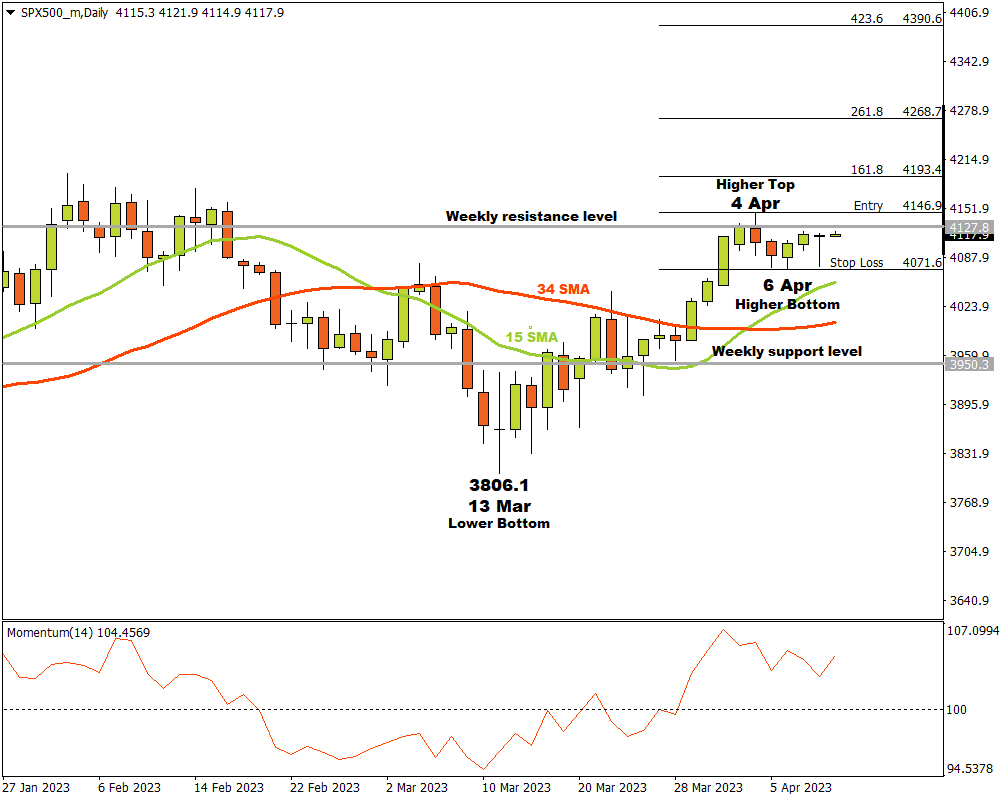
Here’s a look at the S&P 500 from a technical perspective, even as fundamental traders and investors around the world count down to tomorrow’s (Wednesday, April 12) highly-anticipated US inflation data, as we did in our Week Ahead article published this past Friday.
The SPX500_m on the D1 time frame was in a down trend until a lower bottom formed on 13 March at 3806.1.
The bulls found help and started challenging the bearish resolve.
After the lower bottom, the price pushed though a weekly resistance then turned support level and broke through the 15 and 34 Simple Moving Averages.
The Momentum Oscillator provided even more confirmation for technical traders by breaking through the 100 baseline into bullish territory.
At a weekly resistance level, a higher top formed on 4 April at 4146.9.
The bears desperately tried to take back the control of the market but could not follow through and on 6 April the bulls overpowered the bears at a support level near 4071.6.
If the price breaks through the weekly resistance level at 4146.9, then three possible price targets are possible from there.
Attaching the Fibonacci tool to the higher top 4146.9 and dragging it to the bottom of the support level at 4071.6, the following targets can be established:
-
4193.4 (161.8%)
-
4268.7 (261.8%)
- 4390.6 (423.6%)
If the support level at 4071.6 is violated, the scenario is no longer applicable and should be re-analysed.
As long as the bulls keep their momentum with demand overcoming supply, the market sentiment for SP500 on the D1 time frame will be bullish.
