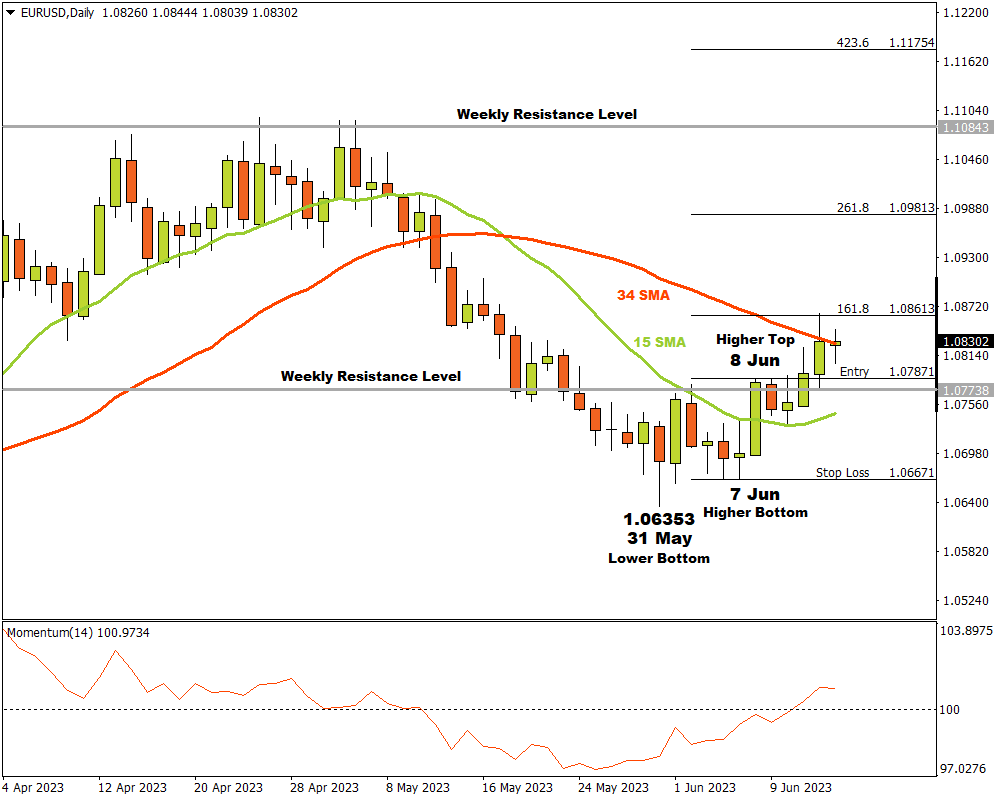
The EURUSD has turned bullish on the daily timeframe. Prices were initially in a down trend until 31 May when a last lower bottom was recorded at 1.06353. After breaking above significant resistance levels, bulls were back in the driving seat with prices advancing to the upside from there.
After rebounding from the lower bottom, prices pressed though the 15 Simple Moving Average (SMA) and the Momentum Oscillator provided confirmation by heading for the 100 baseline and breaking into bullish terrain a bit later.
A higher top was created when the price bounced off a weekly resistance level on 8 June at 1.07871. Bears tried to pull the price lower but they could not make any headway before bulls took over again.
On 12 June the bulls broke through the higher top and weekly resistance level and a long trade was triggered. Three possible targets were possible from there. Attaching the Fibonacci tool to the higher top 1.07871 and dragging it to a higher bottom that was established on 7 June at 1.06671, the following targets were established:
The first potential target was at 1.08613 (161.8%) and the market reached that price on 14 June.
The second price target is likely at 1.09813 (261.8%)
The third and final target may reach 1.11754 (423.6%) if the price are able to break through a weekly resistance level around the 1.10843 level.
If the support level at 1.06671 is broken, this scenario is no longer appropriate, and any open risk must be managed accordingly.
As long as the bulls keep building momentum with demand overcoming supply, the market sentiment for EURUSD on the D1 time frame will remain bullish.