- Market stabilize after sharp selloff in previous session
- SPX500_m could test 200-day SMA
- NQ100_m breaks key daily support
- STOX50_m wobbles above 4100
- UK100_m trapped in wide range
Some semblance of stability returned to global equity markets on Wednesday as rate hike fears cooled after a sharp selloff in the previous session.
European stocks edged higher in tight ranges while US futures are pointing to a mixed open amid the cautious market mood. In the currency arena, the dollar continues to dominate with the USD Index trading at levels not seen since November 2022. Looking at commodities, oil prices surged this morning while gold extended losses thanks to rising Treasury yields and a stronger dollar.
Our attention today falls on major indices which seem to be under the mercy of rate hike fears.
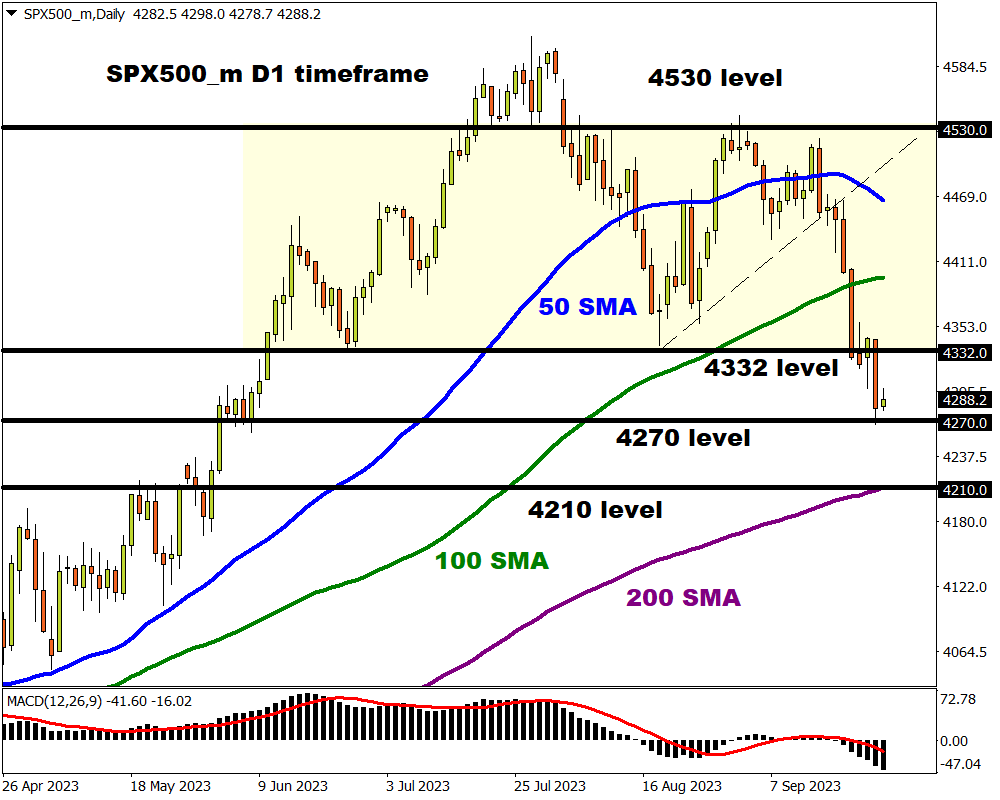
SPX500_m could test 200-day SMA
The bearish case for the SPX500_m was reinforced after prices secured a solid daily close below the 4332 levels.
There have been consistently lower lows and lower highs while the MACD trades below zero. Bears are clearly in a position of power with a breakdown below 4270, opening a path towards the 200-day SMA at 4210. For bulls to jump back into the game, a move back 4332 needs to be achieved.
NQ100_m breaks key daily support
The recent breakdown below the 14670 support level may signal further downside for the NQ100_m with 14250 acting as a key level of interest.
Technical forces favour bears, as there have been consistently lower lows and lower highs while prices are trading below the 50 and 100-day SMA. Should prices push back above 14670, this could trigger a rebound towards the 100-day SMA before the downside resumes.

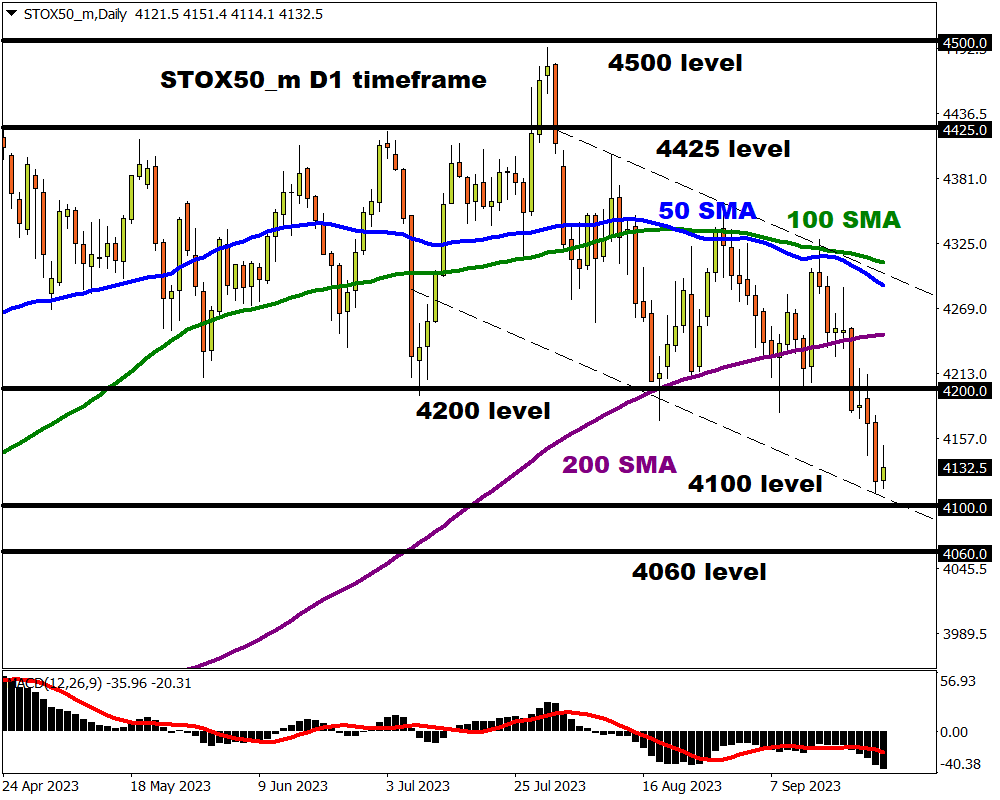
STOX50_m wobbles above 4100
It is safe to say that STOX50_m bears remain in some position of power below the 4200 resistance level.
Prices are approaching another support at 4100, a level not seen since March 2022. A solid breakdown below this level could trigger a selloff towards 4060. Should 4100 prove to be reliable support, prices may push back towards 4200.
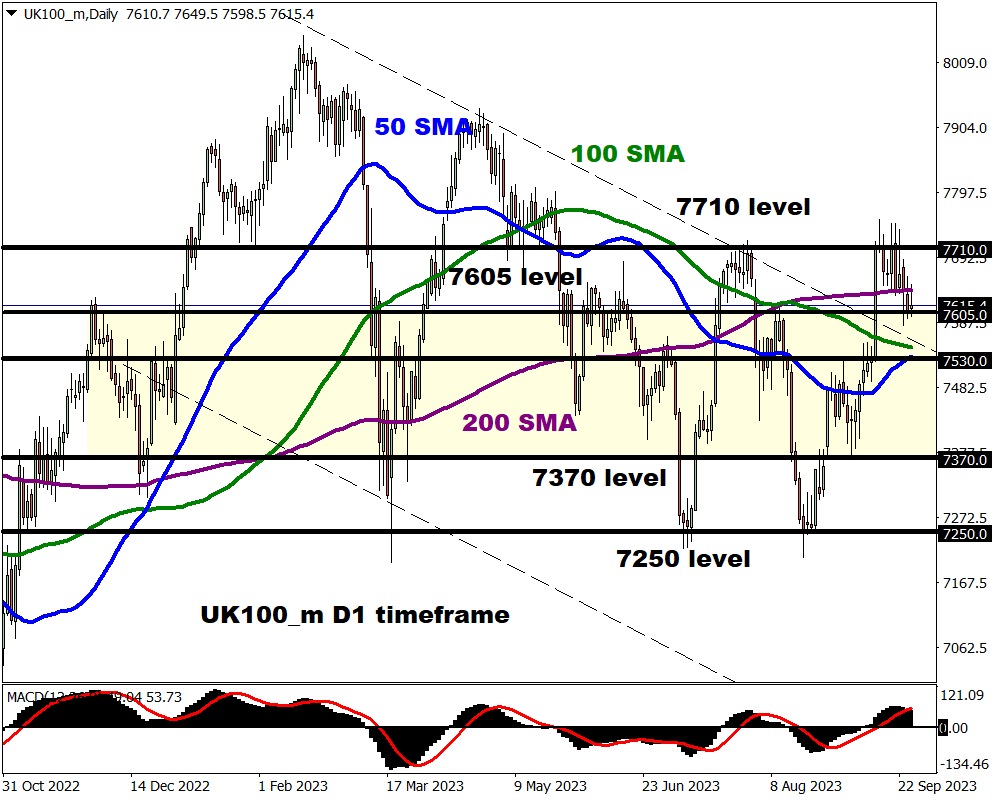
UK100_m trapped in wide range
It remains a choppy affair for the UK100_m which is currently trapped within a very wide range on the daily charts.
Resistance can be found at 7710 and support at 7250. Despite the choppiness, prices could be gearing up to decline given the recent break below the 200-day SMA. A strong daily close under 7605 may spark a selloff towards 7530 – where the 50-day SMA resides. If bulls can fight back, a bounce towards 7710 could be on the cards.