-
SPX500_m printed a doji candlestick on Monday
- Doji candlestick reveals traders' indecision
-
Bulls see impasses as calm before surge to 4400
-
Countertrend opportunity still beckons for bears
- Benchmark stock index still exposed to US Treasury yields moves
SPX500_m may revert to one of its widely-followed moving averages, following the mute session on Monday 6th November.
Note how this index posted a doji on the daily timeframe yesterday.
A doji candlestick typically reveals traders’ indecision.
Hence, Monday’s candlestick formation on the daily timeframe implies that traders are on the hunt for a fresh reason, either to extend the recent surge, or pull back.
SPX500_m bulls may have entered an impasse after last Friday’s (October 3rd) breakout of a downward sloping channel drawn from September 14th close .
The index is currently sitting above its 21-day simple moving average (SMA) and the bears may see an opportunity to retest these key support areas:
-
50-day SMA
-
4339.0: the 78.6 Fibonacci level
-
4313.7: downward channel resistance (now acting as support)
- 4289.2: 21-day SMA converging with the golden 61.8 Fibonacci level
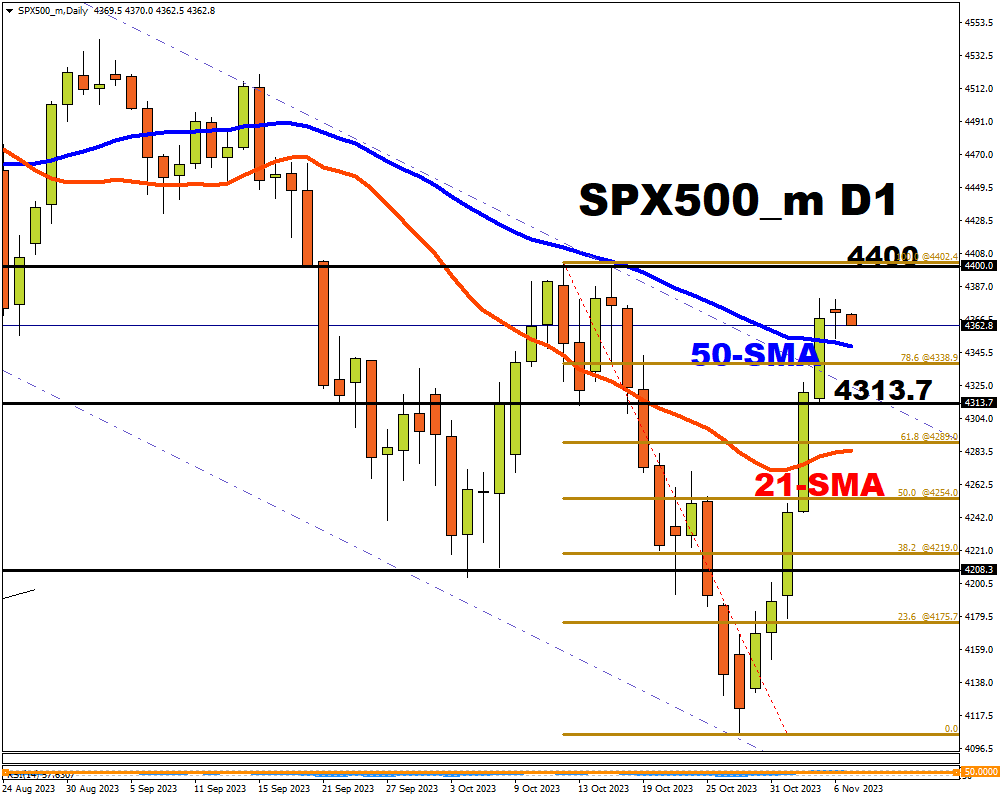
A break back into the downward-sloping channel, with a solid close below its golden 61.8 Fibonacci level at 4289.0, may see a further decline in the SPX500_m where bears may set sights on new lows below 4106.0.
The Fibonacci retracement level is drawn from the October 12th high of 4402 to the October 27th low of 4106.0.
From a bullish perspective, this impasse may be the calm before another raging rally.
The S&P 500 may persist with its gains if investors keep hold of the perception that US bond yields have peaked and could unwind further.
A failure to retest the support areas mentioned above, or a failure to hold a close below 4313.7 ,may see SPX500_m bulls aim for highs above 4400.