-
FXTM recently launched US400 and RUS2000 stock indexes
-
US400 hit record high on March 28th, 2024
-
US400 and RUS2000 are less-popular, more volatile peers of S&P 500 index
-
US CPI release typically triggers 28% bigger intraday moves for RUS2000, 39% for US400
- Wall Street predicts 9% more gains for US400; 21% more for RUS2000 over next 12 months
FXTM’s brand-new stock indices, the US400 and the RUS2000, may present larger-than-average trading opportunities this week.
After all, markets are on high alert for the upcoming release of the US consumer price index (CPI) for March 2024, due to announced at 12:30PM GMT tomorrow (Wednesday, April 10th).
What is CPI?
The consumer price index (CPI) is used to measure a country’s inflation rate.
Red-hot inflation after the pandemic has been enemy number #1 for the US Federal Reserve a.k.a. the Fed – the most important central bank in the world.
Why do markets care about the CPI?
Traders and investors worldwide will be eager to find out this latest set of inflation numbers out of the world’s largest economy (the USA).
These inflation figures are set to influence the Fed’s plans for cutting US interest rates this year.
After all, the Fed has a target of bringing US inflation down to the 2% mark.
Here’s what economists are forecasting for this pivotal CPI print:
-
Headline CPI in March 2024 vs. March 2023 (year-on-year): 3.4%
If so, that 3.4% would be higher than February’s 3.2% year-on-year figure
-
Headline CPI in March 2024 vs. February 2024 (month-on-month): 0.3%
If so, that 0.3% would be lower than February’s 0.4% month-on-month figure
-
Core CPI (excluding food and energy prices) year-on-year: 3.7%
If so, that 3.7% would be lower than February’s 3.8% year-on-year figure
-
Core CPI month-on-month: 0.3%
If so, that 0.3% would be lower than February’s 0.4% month-on-month figure
What is a stock index?
Imagine a stock index being a basket of many different stocks.
The index measures the overall performance of those stocks inside that “basket”.
What do the US400 and RUS2000 indexes measure?
-
US400
The US400 index tracks the underlying S&P Midcap 400 index, which measures the mid-sized companies listed on US stock markets.
Mid-sized companies on this index have a market capitalisation of between US$1.3 billion to about US$26 billion.
-
RUS2000
The RUS2000 index tracks the underlying Russell 2000 index, which measures the smallest 2000 companies in the broader Russell 3000 index.
According to FTSE Russell Insights, The Russell 2000 index is a better representation of the "domestic US economy and its powerhouse small company segment."
In other words ...
the RUS2000 gives investors a better idea of how the "real" US economy is actually faring
(as opposed to the tech-led stock indices such as the US500 or the NAS100).
How might the US400 and RUS2000 indexes react to the CPI data?
Note that riskier assets, including stock indexes, tend to rejoice at the thought of interest rates moving lower.
-
Hence, US stock indices might push higher when shown proof that US inflation is moving closer to the Fed’s 2% target.
- On the other hand, stock markets may be pulled back lower if US inflation is proving stubborn, potentially forcing the Fed to maintain its benchmark rates at the current peak for longer.
How have the US400 and RUS2000 indexes reacted to past CPI releases?
-
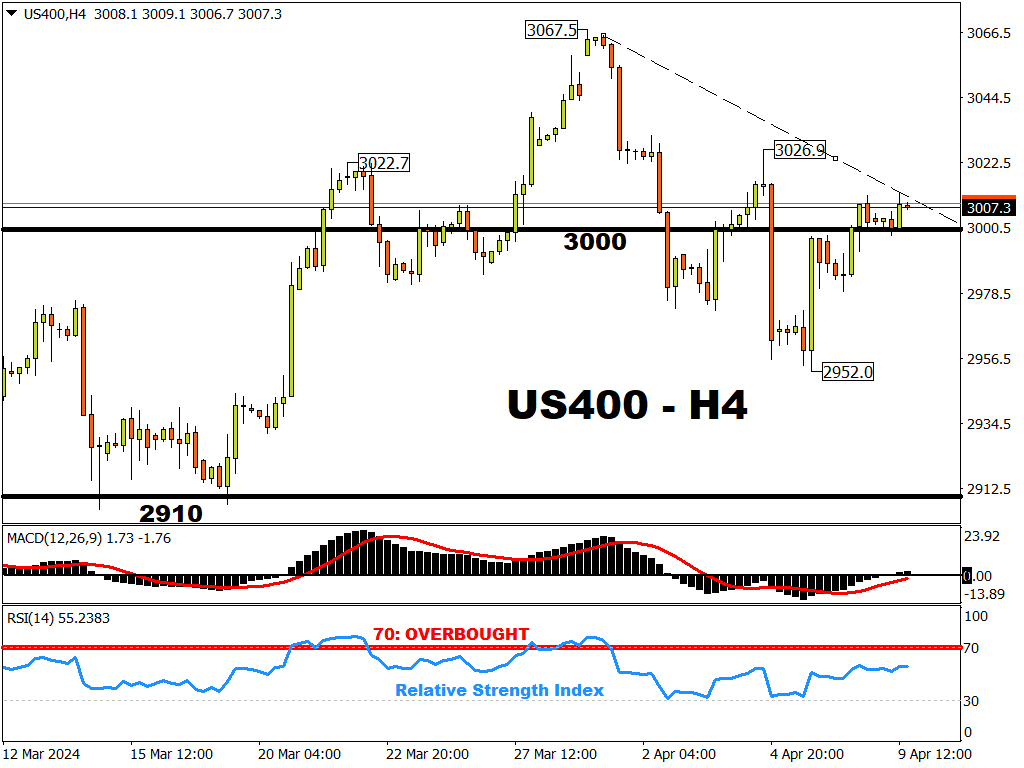
US400
Over the past year, the US400 index sees an average difference/spread between its intraday highest price and its lowest intraday price of 34.
On CPI days, the US400 typically sees a 39% larger-than-average move, which translates into 13 index points higher than average.
In fact, the biggest intraday move for the US400 index over the past 12 months occurred on 14th November 2023 – a CPI release day.
That day resulted in a difference of 100 index points between its highest and lowest intraday prices, which is 200% more than the average!
-
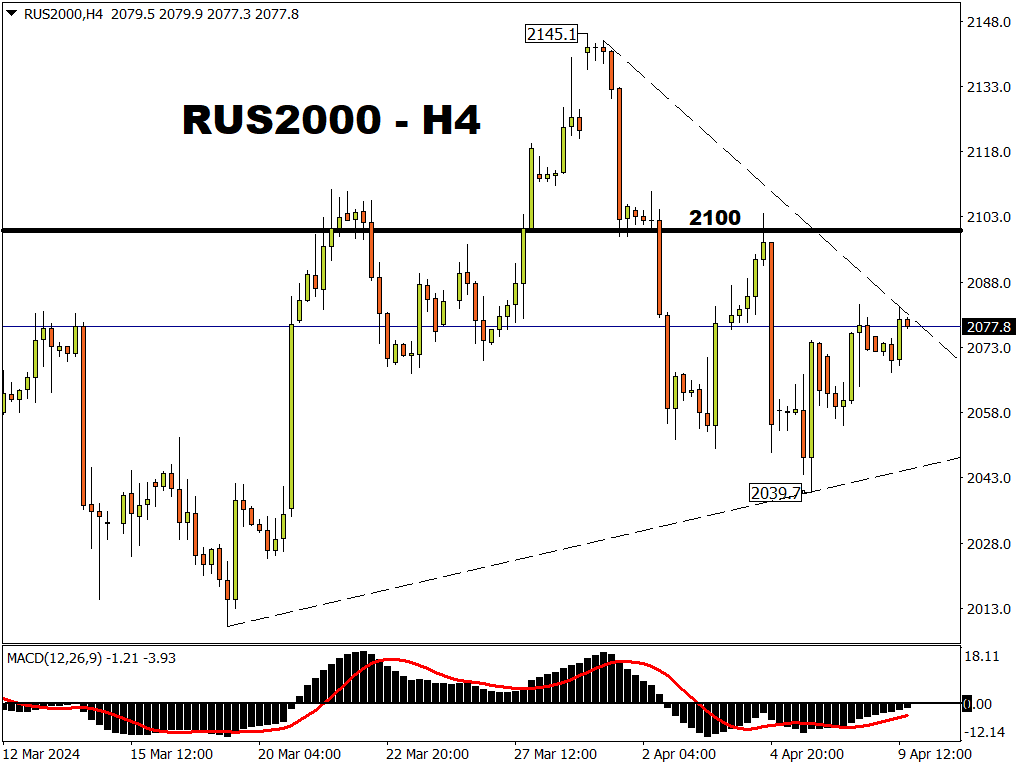
RUS2000
Over the past year, the RUS2000 index sees an average difference/spread between its intraday highest price and its lowest intraday price of 25.
On CPI days, the RUS2000 typically sees a 27.8% larger-than-average move, which translates into 7 index points higher than average.
In short, if the CPI numbers shock markets, that is likely to result in a larger-than-usual move for these stock indexes.
And that in turn should lend itself to outsized short-term trading opportunities!
US400, RUS2000 are smaller, but more volatile than US500 index
Here's the total market capitalisation for each of these US stock indexes:
-
US500 (S&P 500): US$ 45.5 trillion
-
RUS2000 (Russell 2000): US$ 3 trillion
- US400 (S&P Midcap 400): US$ 2.9 trillion
Over the past 30 days, here are the volatility readings for each of these US stock indexes:
-
US500: 10.4
-
US400: 12.4
- RUS2000: 16.3
If the volatility from the past 30 days persists ...
then the US400 and RUS2000 indexes, though smaller than the more-popular US500, should offer greater trading opportunities come CPI release day!
How high could the US400 and RUS2000 indices go?
-
US400
Wall Street expects the S&P Midcap 400 index to climb by another 9% over the next 12 months, potentially sending this index above the 3,200 mark.
-
RUS2000
Wall Street expects the Russell 2000 index to climb by another 21% over the next 12 months, potentially sending this index above the 2,500 mark.