- Soybean ↑ 5% month-to-date
- Influenced by various fundamentals
- Trapped in range on W1 timeframe
- Breakout on the horizon?
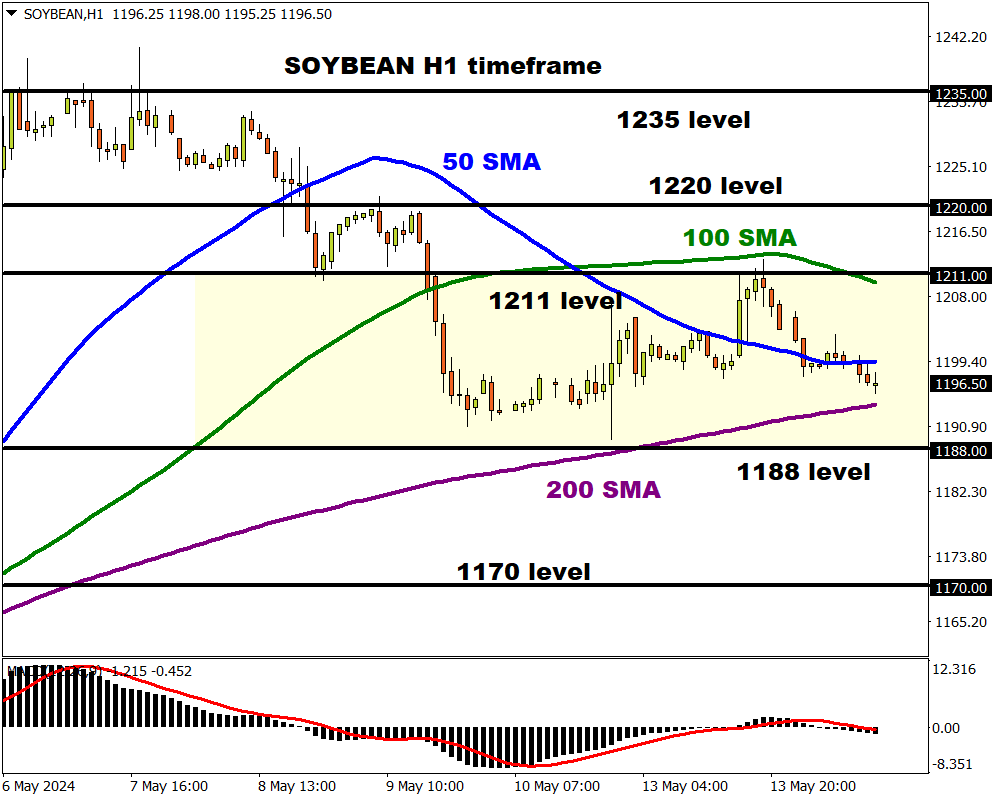
- Key levels at 1211, 1188, 1170
After bouncing within a weekly range since mid-January, FXTM’s new Soybean commodity could be on the brink of a major breakout!
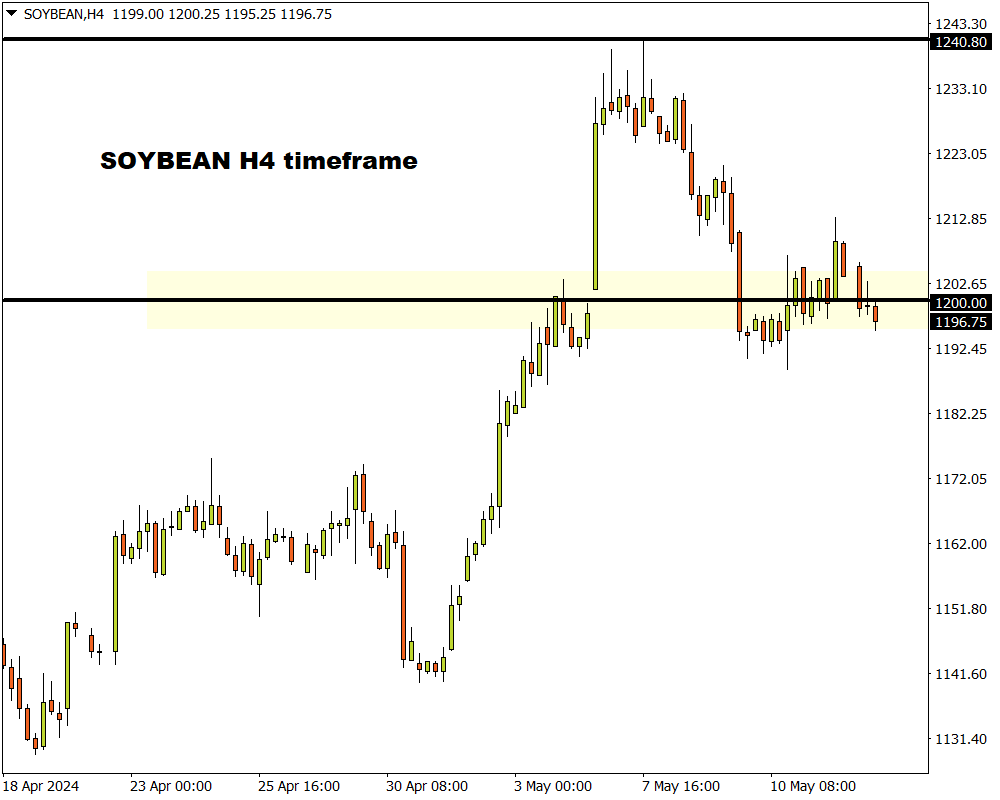
Prices are flirting around the 1200 weekly resistance level as bulls and bears wait for a fresh directional catalyst.
Note: Soybean is priced per bushel. One bushel is equivalent to 60 pounds.
Before we break down the fundamentals, here are some fun facts about soybean:
-
Ancient crop that originates from China
-
More than 2500 varieties
-
Brazil is the biggest producer & exporter
-
China is the biggest importer
-
Gained over 5% month-to-date
What is a Soybean?
It is simply the edible bean of a soya plant.
Humans and animals can consume this bean, also used for industrial and consumer products!
Note: Soybean oil is extracted from soybeans. Soybean meal is the by-product of the extraction process.
Both can be traded along with Soybean on the CBOT (Chicago Board of Trade).
What does FXTM’s Soybean track?
FXTM’s Soybean tracks the CME Group’s Soybean futures, providing access to one of the world’s most widely grown crops.
The lowdown…
Soybean prices have been shaky in 2024, shedding almost 7% year-to-date.
A combination of rising global stockpiles and uncertainty over China’s demand has pressured the soft commodity.
Back in March, reports showed that China imported 13.04 million metric tons of soybeans for the first two months of 2024 – the lowest in 5 years.
Considering how China accounts for roughly 60% of global imports, it plays a key role in Soybeans outlook.
The bigger picture…
Brazil, the United States, and Argentina account for roughly 80% of total Soybean production.
Developments in these regions combined with demand from China are likely to heavily influence its outlook for 2024.
There have been reports of severe weather conditions in Brazil threatening supplies of key agricultural commodities including soybeans. These concerns were reflected in the latest USDA report published last Friday which lowered estimates for Brazil's production.
However, U.S. farmers are expected to produce near-record amounts of Soybean this year – adding to the rising global inventories.
What does this mean?
The various fundamental forces pulling and tugging at Soybeans could translate to fresh volatility.
Where there is volatility, this presents opportunities.
Technical outlook…
Soybean prices remain in a wide range on the weekly charts with key support found around 1130 and resistance at 1200.
Zooming into the H1 timeframe, another range is in play with support at 1188 and resistance at 1211. Prices are trading below the 100 and 50 SMA and currently testing the 200 SMA.
-
A solid H1 close below 1188 could inspire a decline towards 1170.
-
Should prices push back above the 50 SMA, this could open a path back to 1211.
-
A break above 1211 may see prices test 1220 and 1235.