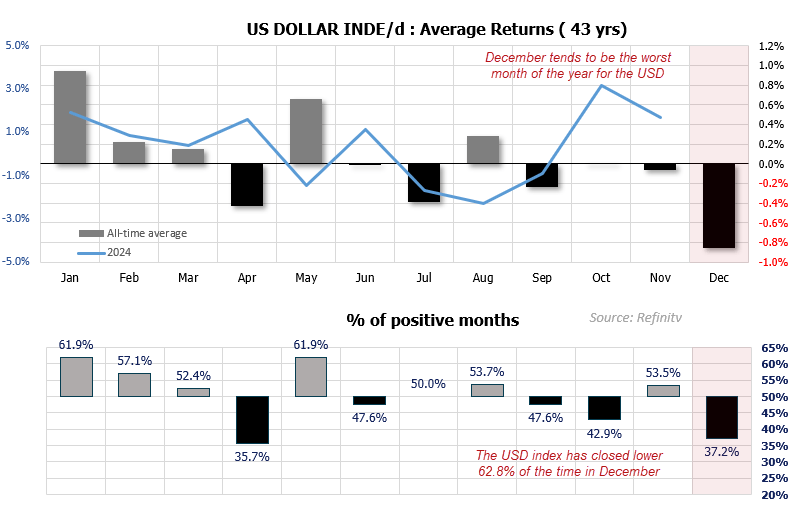
It may be well documented, but it is also worth remembering that the December tends to be the most bearish month for the US dollar.
Data of the past 43 years shows the USD index has:
- Delivered the worst returns of the year in December (-0.86% average, -0.69% median)
- Closed lower 62.8% of the time in December
- Delivered the strongest returns of the year in January (0.94% average, 0.79% median)
- Closed higher 61.9% of the time in January

The pattern shows it is clearly a game of two halves in December through to January for the US dollar. But with President-elect Trump moving markets before his second term even begins, it’s possible that seasonality may take a back seat for now. Trump is defending the US dollar, aiming to quash the rise of a BRICS currency by threatening constituent countries with 100% tariffs unless they cancel work on it. And this could be just one of many themes he could surprise markets with as the month develops, which makes trusting seasonality that much harder.
However…

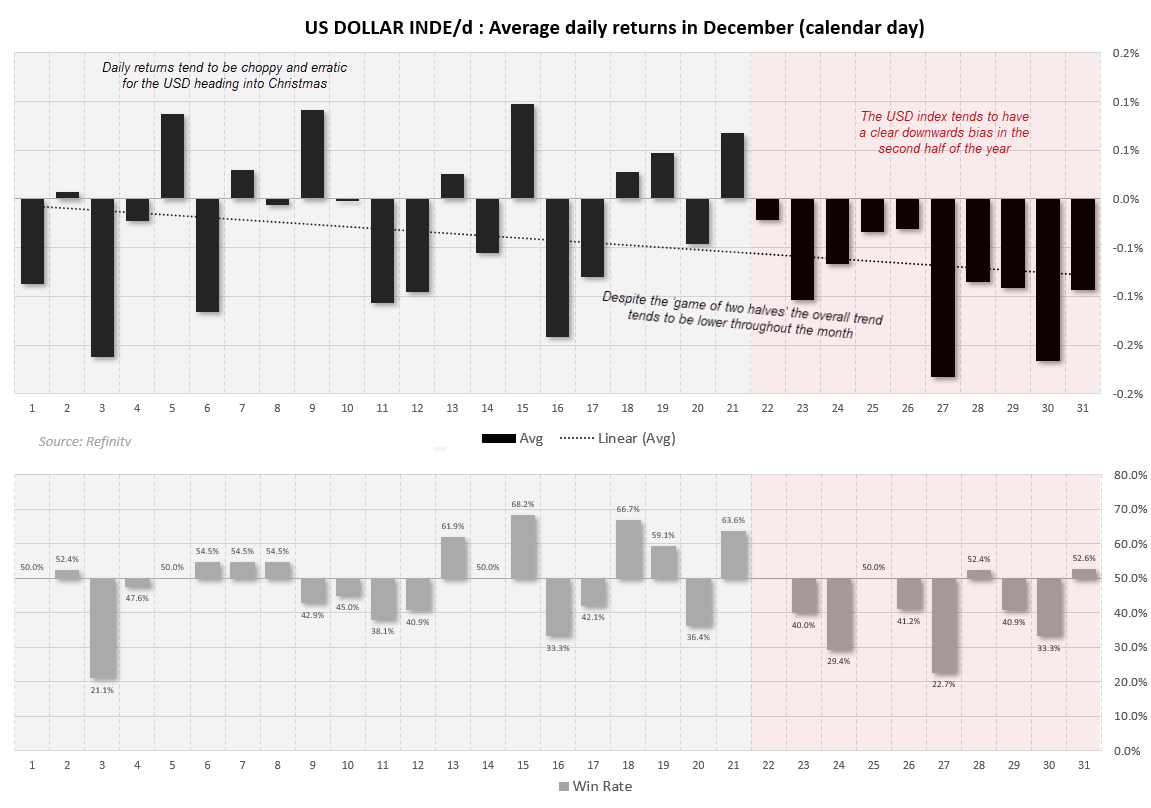
December is also a game of two halves, where seasonality is concerned
looking at daily data of the USD index in December, two clear patterns emerge.
- Average daily returns are choppy and erratic in the first half of December
- There is a clear bearish bias in the second half of December

I think it is safe to suspect the first half of this month could be in for some twists and turns with Trump already at the helm, which could deliver the erratic and choppy price action we tend to see this time of the year. And if we also factor in the FOMC meeting, which concludes on December 18th (with updated staff forecasts in all its glory), then we may find that a trend is allowed to develop as we head into the new year. Liquidity will also dry up the closer we get to New Year's Eve, which could also pave the way for one-directional trade. But whether that will result in a bullish or bearish month for the USD is up in the air for me.

USD technical analysis:
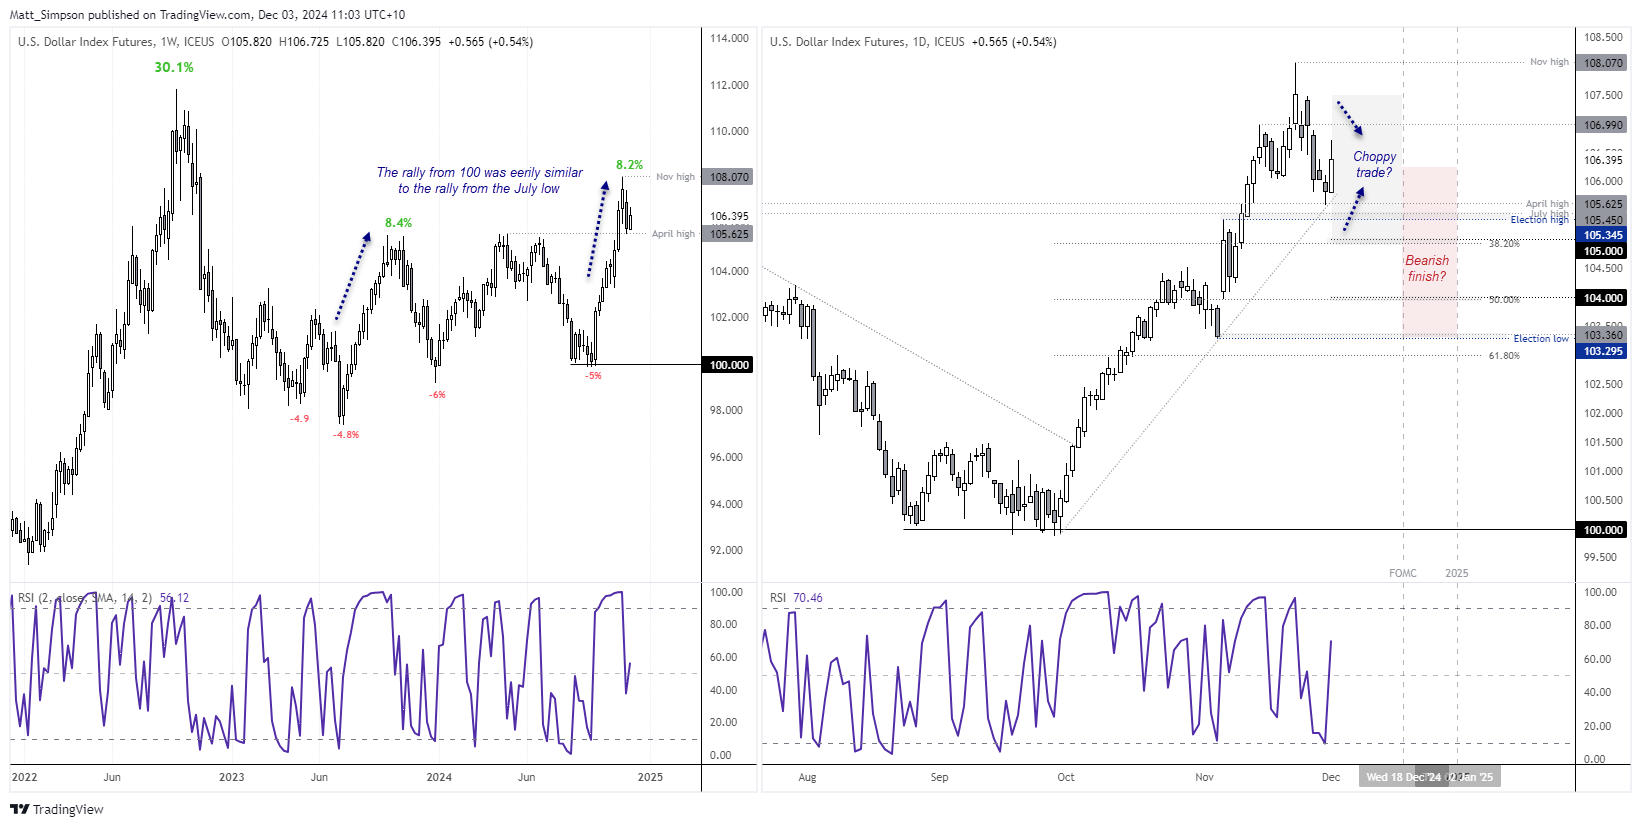
At 8.2% from low to high, the rally from the 100 handle was eerily similar to the one seen from the July low to September high of 8.4%. It was a scenario discussed in previous articles. With that objective now achieved, the USD is looking for a fresh catalyst to prompt its next directional move.
Given we just saw the most bearish week for the USD index since mid-August, a correction is now underway. This aligns with the theme of choppy price action heading towards the FOMC meeting on December 18th, before traders get more clarity over Fed policy for next year and the end-of-year seasonality kicks in.
105.35 (election high) to 105.63 makes an important support zone over the near-term, which could cap gains on EUR/USD to below 1.06 for now. Even if the USD index dips back within the ‘election day’ range, the 105 handle near the 38.2% Fibonacci ratio of the recent rally could provide support.
Given my expectations of choppy trading conditions into the FOMC meeting, traders may want to consider looking at setups on a ‘per day’ basis.
Whether we’ll see the USD rise or fall in the second half of the month is probably in the hands of how hawkish the Fed is, alongside Trump’s appetite to defend the US dollar.

How to trade with FOREX.com
Follow these easy steps to start trading with FOREX.com today:
- Open a Forex.com account, or log in if you’re already a customer.
- Search for the pair you want to trade in our award-winning platform.
- Choose your position and size, and your stop and limit levels.
- Place the trade.