US Dollar Outlook: USD/CAD
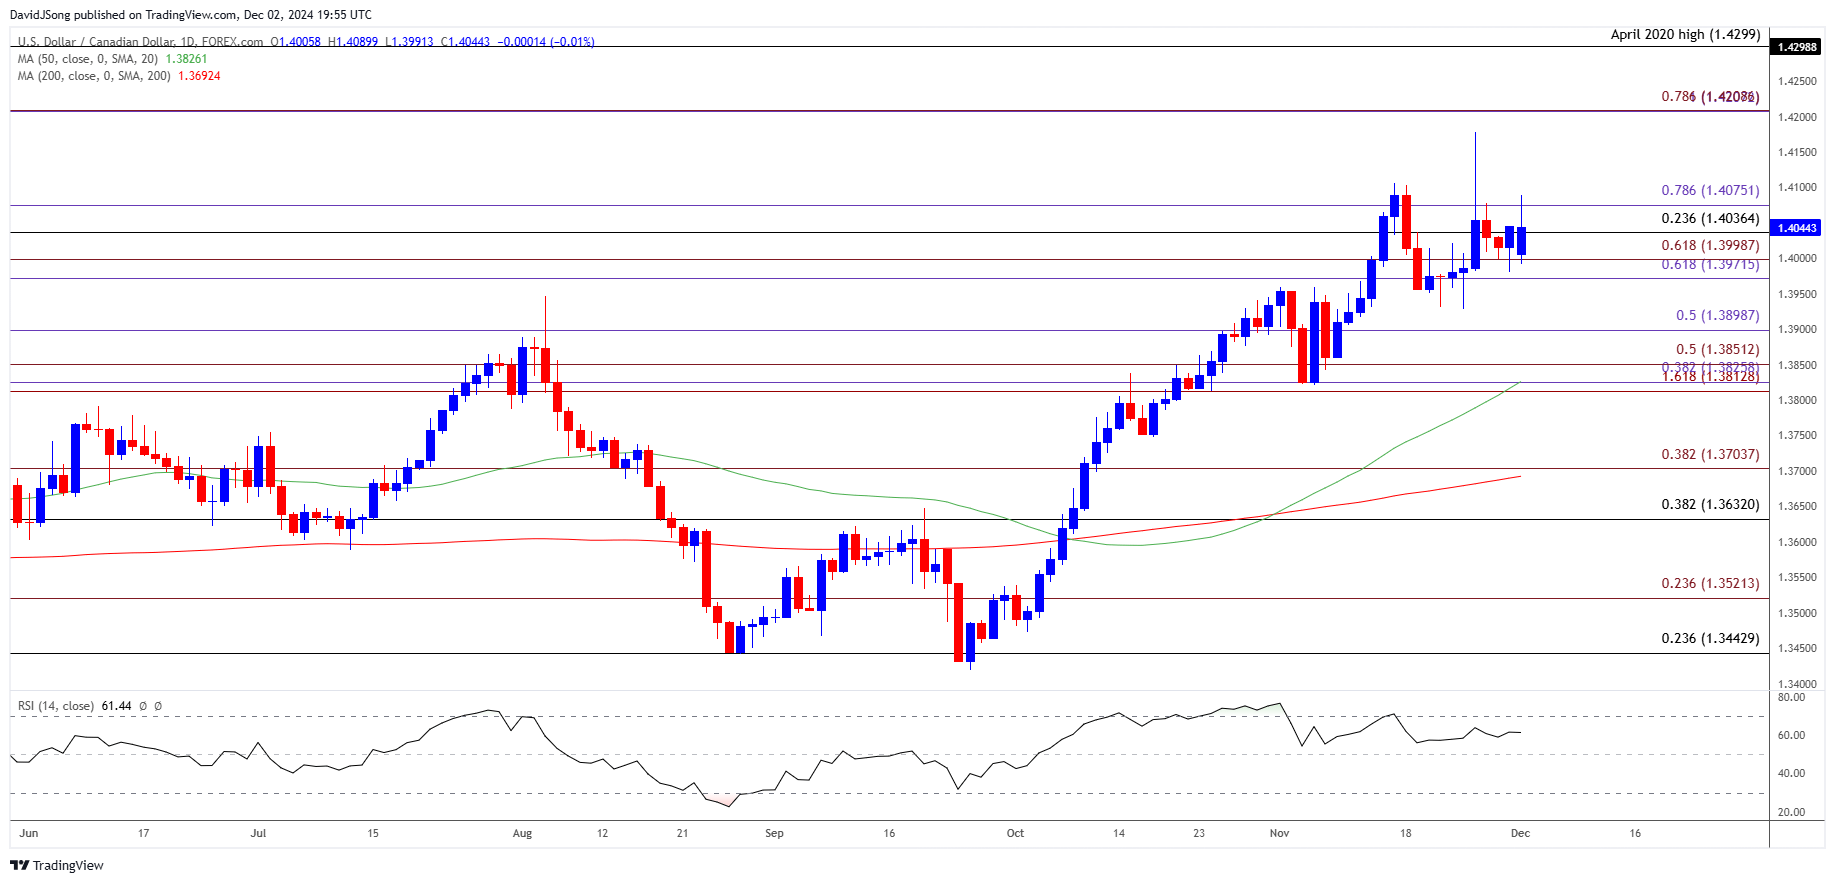
USD/CAD may test the November high (1.4178) as it appears to be defending the rally following the US election, but the Relative Strength Index (RSI) seems to be diverging with price as the recent advance in the exchange rate failed to push the oscillator into overbought territory.
USD/CAD Defends Post-US Election Rally to Eye November High
Keep in mind, USD/CAD briefly pushed above the May 2020 high (1.4173) as President-elect Donald Trump threatens to impose tariffs on Canada, and the exchange rate may reestablish the bullish trend from earlier this year as the 50-Day SMA (1.3826) develops a positive slope.
Join David Song for the Weekly Fundamental Market Outlook webinar.
David provides a market overview and takes questions in real-time. Register Here
As a result, a further advance in USD/CAD may push the RSI towards overbought territory, but the oscillator may show the bullish momentum abating should the indicator struggle to push above 70.
US Economic Calendar

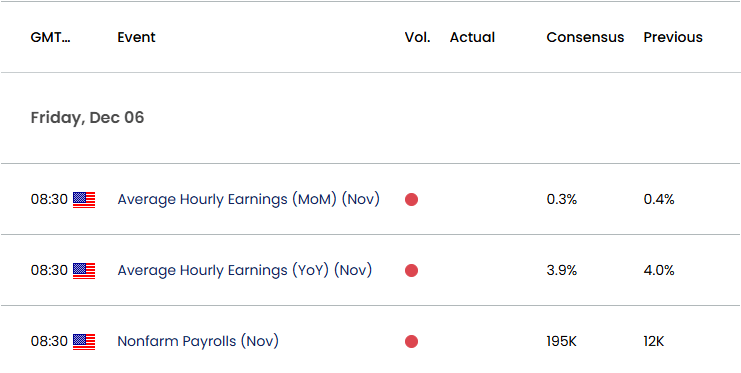
In turn, USD/CAD may consolidate ahead of the US Non-Farm Payrolls (NFP) report, but the update from the Bureau of Labor Statistics (BLS) may generate a bullish reaction in the Greenback as the economy is anticipated to add 195K jobs in November following the 12K expansion the month prior.
With that said, USD/CAD may test the November high (1.4178) as signs of a resilient labor market dampen speculation for another Federal Reserve rate-cut, but a weaker-than-expected NFP report may produce headwinds for the Greenback as it puts pressure on the central bank to implement lower interest rates ahead of 2025.
USD/CAD Price Chart – Daily

Chart Prepared by David Song, Strategist; USD/CAD Price on TradingView
- USD/CAD seems to be defending the post-US election rally as it holds above the 1.3970 (61.8% Fibonacci extension) to 1.4000 (61.8% Fibonacci extension) zone, with a breach above the November high (1.4178) bringing 1.4210 (78.6% Fibonacci extension) back on the radar.
- Next region of interest coming in around the April 2020 high (1.4299) but lack of momentum to close above the 1.4040 (23.6% Fibonacci retracement) to 1.4080 (78.6% Fibonacci extension) area may keep USD/CAD within the November range.
- Failure to hold above the 1.3970 (61.8% Fibonacci extension) to 1.4000 (61.8% Fibonacci extension) zone may push USD/CAD towards 1.3900 (50% Fibonacci extension), with the next area of interest coming in around 1.3810 (161.8% Fibonacci extension) to 1.3850 (50% Fibonacci extension), which incorporates the November low (1.3821).
Additional Market Outlooks
US Dollar Forecast: USD/JPY Gives Back Post-US Election Rally
US Dollar Forecast: GBP/USD Still Vulnerable to Test of May Low
NZD/USD Rebounds Ahead of 2023 Low with RBNZ Expected to Cut
Gold Price Stages Five-Day Rally for First Time Since March
--- Written by David Song, Senior Strategist
Follow on Twitter at @DavidJSong
