Gold Talking Points:
- Gold had previously built-in a consistent range. This followed the election sell-off that led-in to the strongest weekly outing for gold since the regional banking crisis in Q1 of 2023.
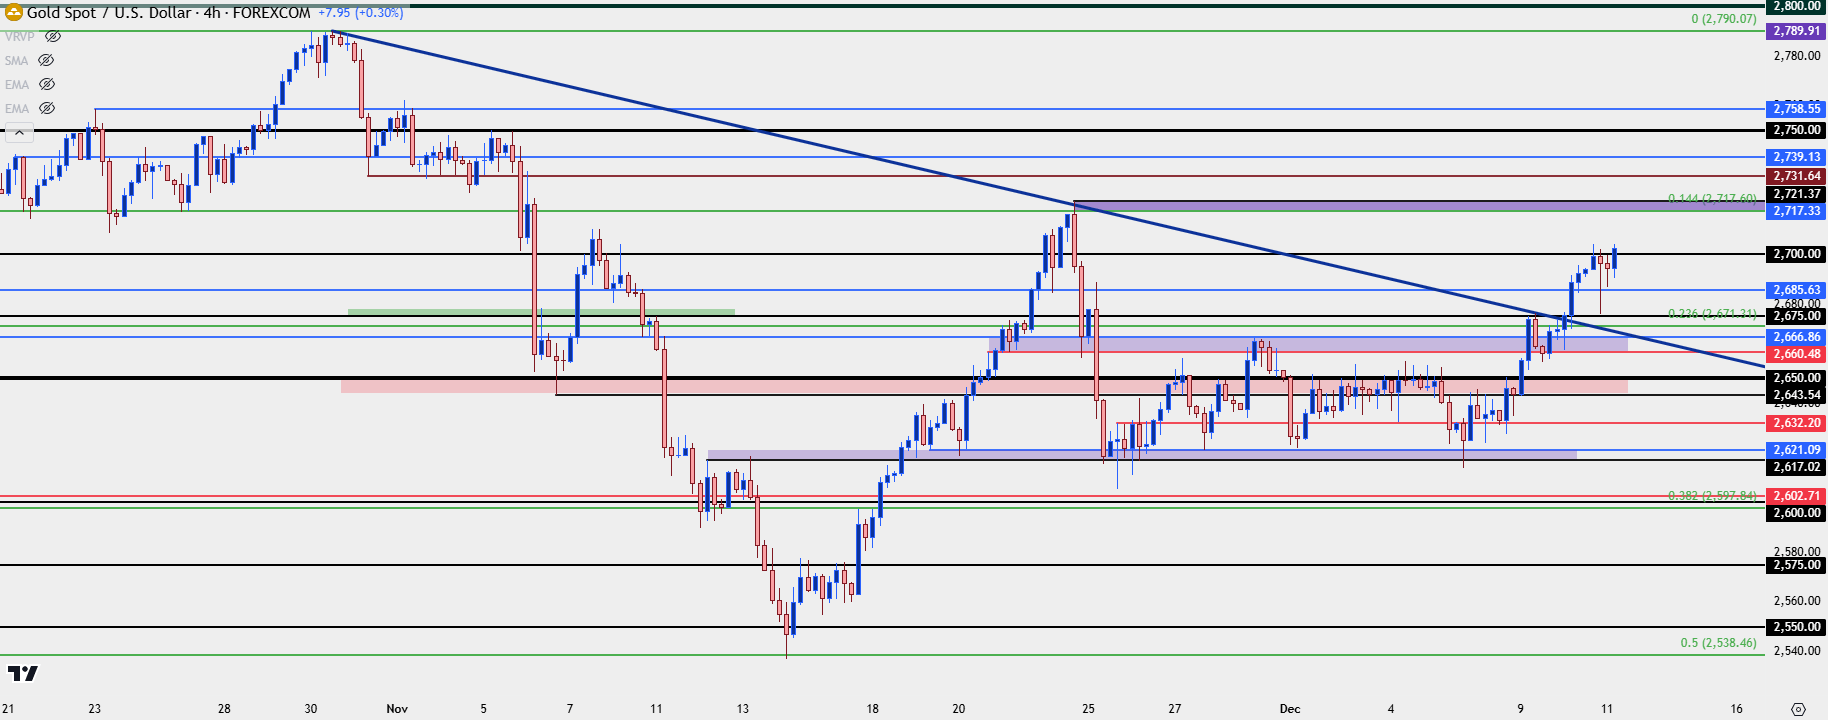
- Range support was tested last Thursday at 2617-2621 and since then, bulls have been pushing a topside trend with the 2700 level coming into play today. The next resistance sitting overhead is the same high that held prices after the post-election bounce, which spans with a Fibonacci level to create a zone $100 above prior range support, from 2717-2721.

It’s been a strong week for gold prices, which stands in contrast to the prior week-and-a-half when prices held within a consistent range, with support at 2617-2621 and resistance at 2643-2650 and 2660-2666.
I looked into the range at last week’s webinar when gold was grinding in the 2643-2650 zone; and a support test showed up two days later at 2617-2621. As the weekly bar closed price remained within that range, but it was around this week’s open when bulls started to stretch it, driving a Monday rally to the next point of resistance at 2675. That held the highs for a brief pullback but at that point, support showed at prior resistance, spanning from the 2660-2666 zone and that held as a higher-low, leading to another breakout.
When I looked at gold in yesterday’s webinar it was already close to the 2700 level, and as I shared then, bulls were exhibiting firm control of the move. There was support potential at prior resistance levels of both 2675 and 2685. The first test of 2700 led to a pullback but buyers held it above 2675, setting the stage for a second test which is taking place right now.
The next key zone overhead for bulls to encounter on continuation pushes is the same that held the highs in late-November, from 2717-2721. The 2717 level is the 14.4% retracement of the same major move that set the lows last month at the 50% mark; and 2721 is the swing high from that move. Collectively the two prices create a zone $100 above last week’s support of 2617-2621.
Gold Four-Hour Price Chart
 Chart prepared by James Stanley; data derived from Tradingview
Gold Bigger Picture
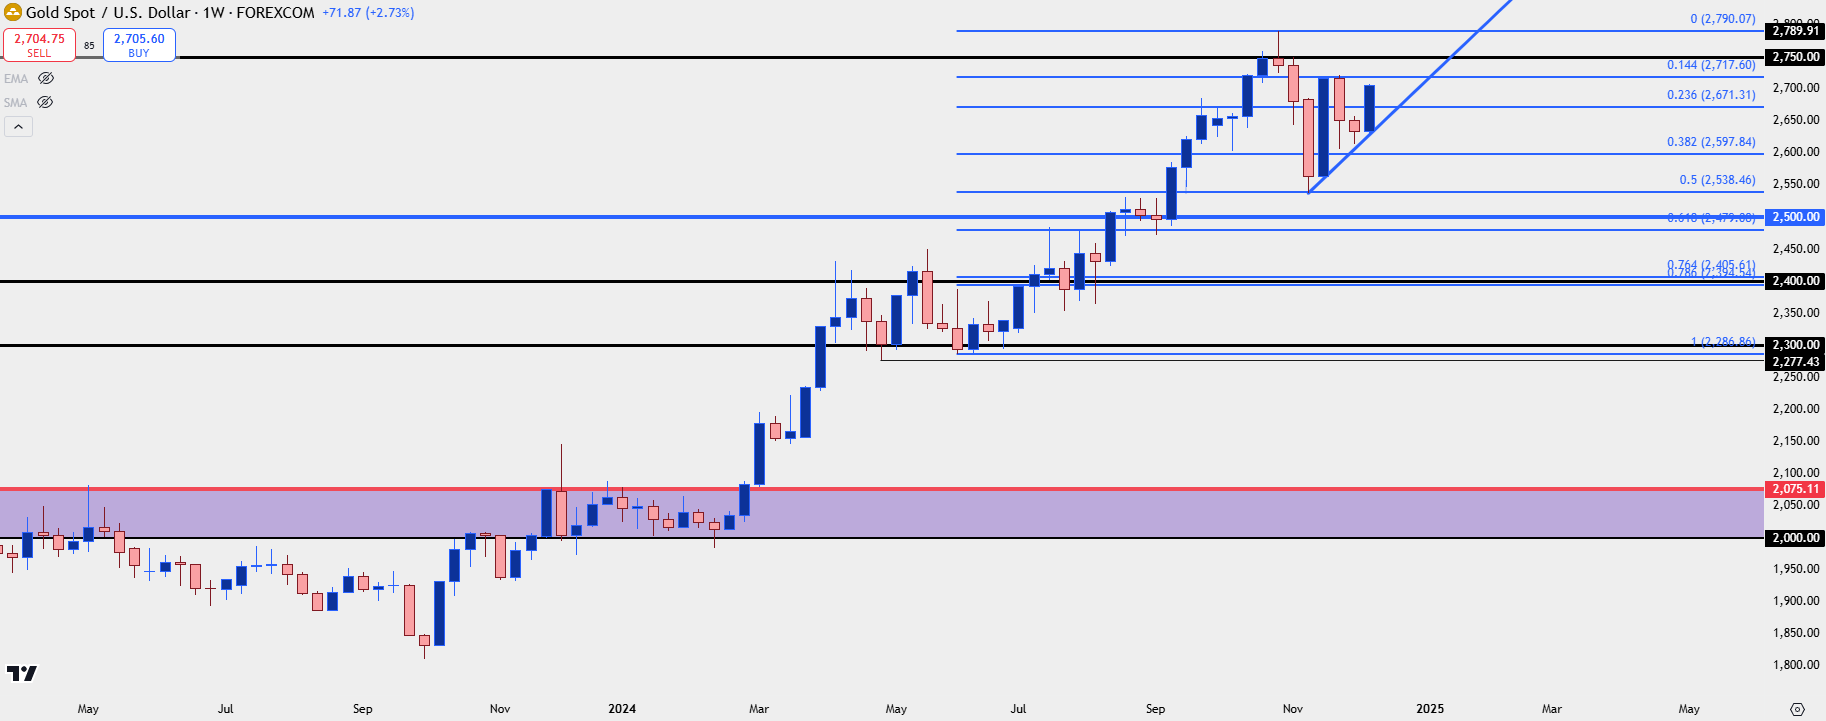
It was a strong run for gold in 2024 and that started to come into question after the election-fueled pullback. But this week’s strength is encouraging for gold bulls and this shows a clear sign of re-claiming control following the support exhibited on the past two weekly candles.
But, this also sets the stage for a key test at that 2717 Fibonacci level and that’s a price that buyers would want to see a weekly bar close above, as opposed to an upper wick indicating resistance response that could spell further consolidation.
Above 2717, it’s the 2750 level that buyers stumbled at in October and the 2800 level was left completely un-tested in spot, as the high printed about $10 inside of that big figure.
Gold Weekly Chart
 Chart prepared by James Stanley; data derived from Tradingview
--- written by James Stanley, Senior Strategist
Gold Talking Points:
- Gold had previously built-in a consistent range. This followed the election sell-off that led-in to the strongest weekly outing for gold since the regional banking crisis in Q1 of 2023.
- Range support was tested last Thursday at 2617-2621 and since then, bulls have been pushing a topside trend with the 2700 level coming into play today. The next resistance sitting overhead is the same high that held prices after the post-election bounce, which spans with a Fibonacci level to create a zone $100 above prior range support, from 2717-2721.
It’s been a strong week for gold prices, which stands in contrast to the prior week-and-a-half when prices held within a consistent range, with support at 2617-2621 and resistance at 2643-2650 and 2660-2666.
I looked into the range at last week’s webinar when gold was grinding in the 2643-2650 zone; and a support test showed up two days later at 2617-2621. As the weekly bar closed price remained within that range, but it was around this week’s open when bulls started to stretch it, driving a Monday rally to the next point of resistance at 2675. That held the highs for a brief pullback but at that point, support showed at prior resistance, spanning from the 2660-2666 zone and that held as a higher-low, leading to another breakout.
When I looked at gold in yesterday’s webinar it was already close to the 2700 level, and as I shared then, bulls were exhibiting firm control of the move. There was support potential at prior resistance levels of both 2675 and 2685. The first test of 2700 led to a pullback but buyers held it above 2675, setting the stage for a second test which is taking place right now.
The next key zone overhead for bulls to encounter on continuation pushes is the same that held the highs in late-November, from 2717-2721. The 2717 level is the 14.4% retracement of the same major move that set the lows last month at the 50% mark; and 2721 is the swing high from that move. Collectively the two prices create a zone $100 above last week’s support of 2617-2621.
Gold Four-Hour Price Chart
 Chart prepared by James Stanley; data derived from Tradingview
Gold Bigger Picture
It was a strong run for gold in 2024 and that started to come into question after the election-fueled pullback. But this week’s strength is encouraging for gold bulls and this shows a clear sign of re-claiming control following the support exhibited on the past two weekly candles.
But, this also sets the stage for a key test at that 2717 Fibonacci level and that’s a price that buyers would want to see a weekly bar close above, as opposed to an upper wick indicating resistance response that could spell further consolidation.
Above 2717, it’s the 2750 level that buyers stumbled at in October and the 2800 level was left completely un-tested in spot, as the high printed about $10 inside of that big figure.
Gold Weekly Chart
 Chart prepared by James Stanley; data derived from Tradingview
--- written by James Stanley, Senior Strategist