Japanese Yen, JPY, USD/JPY Talking Points:
- USD/JPY put in a strong move around the FOMC rate decision last month as the Fed sounded less-dovish for 2025.
- USD/JPY bulls have largely remained in-control since, and early-2025 price action has shown support holding at a prior zone of resistance.
- I look at both USD/JPY and the U.S. Dollar in-depth during each Tuesday webinar, and you’re welcome to join the next one. Click here for registration information.

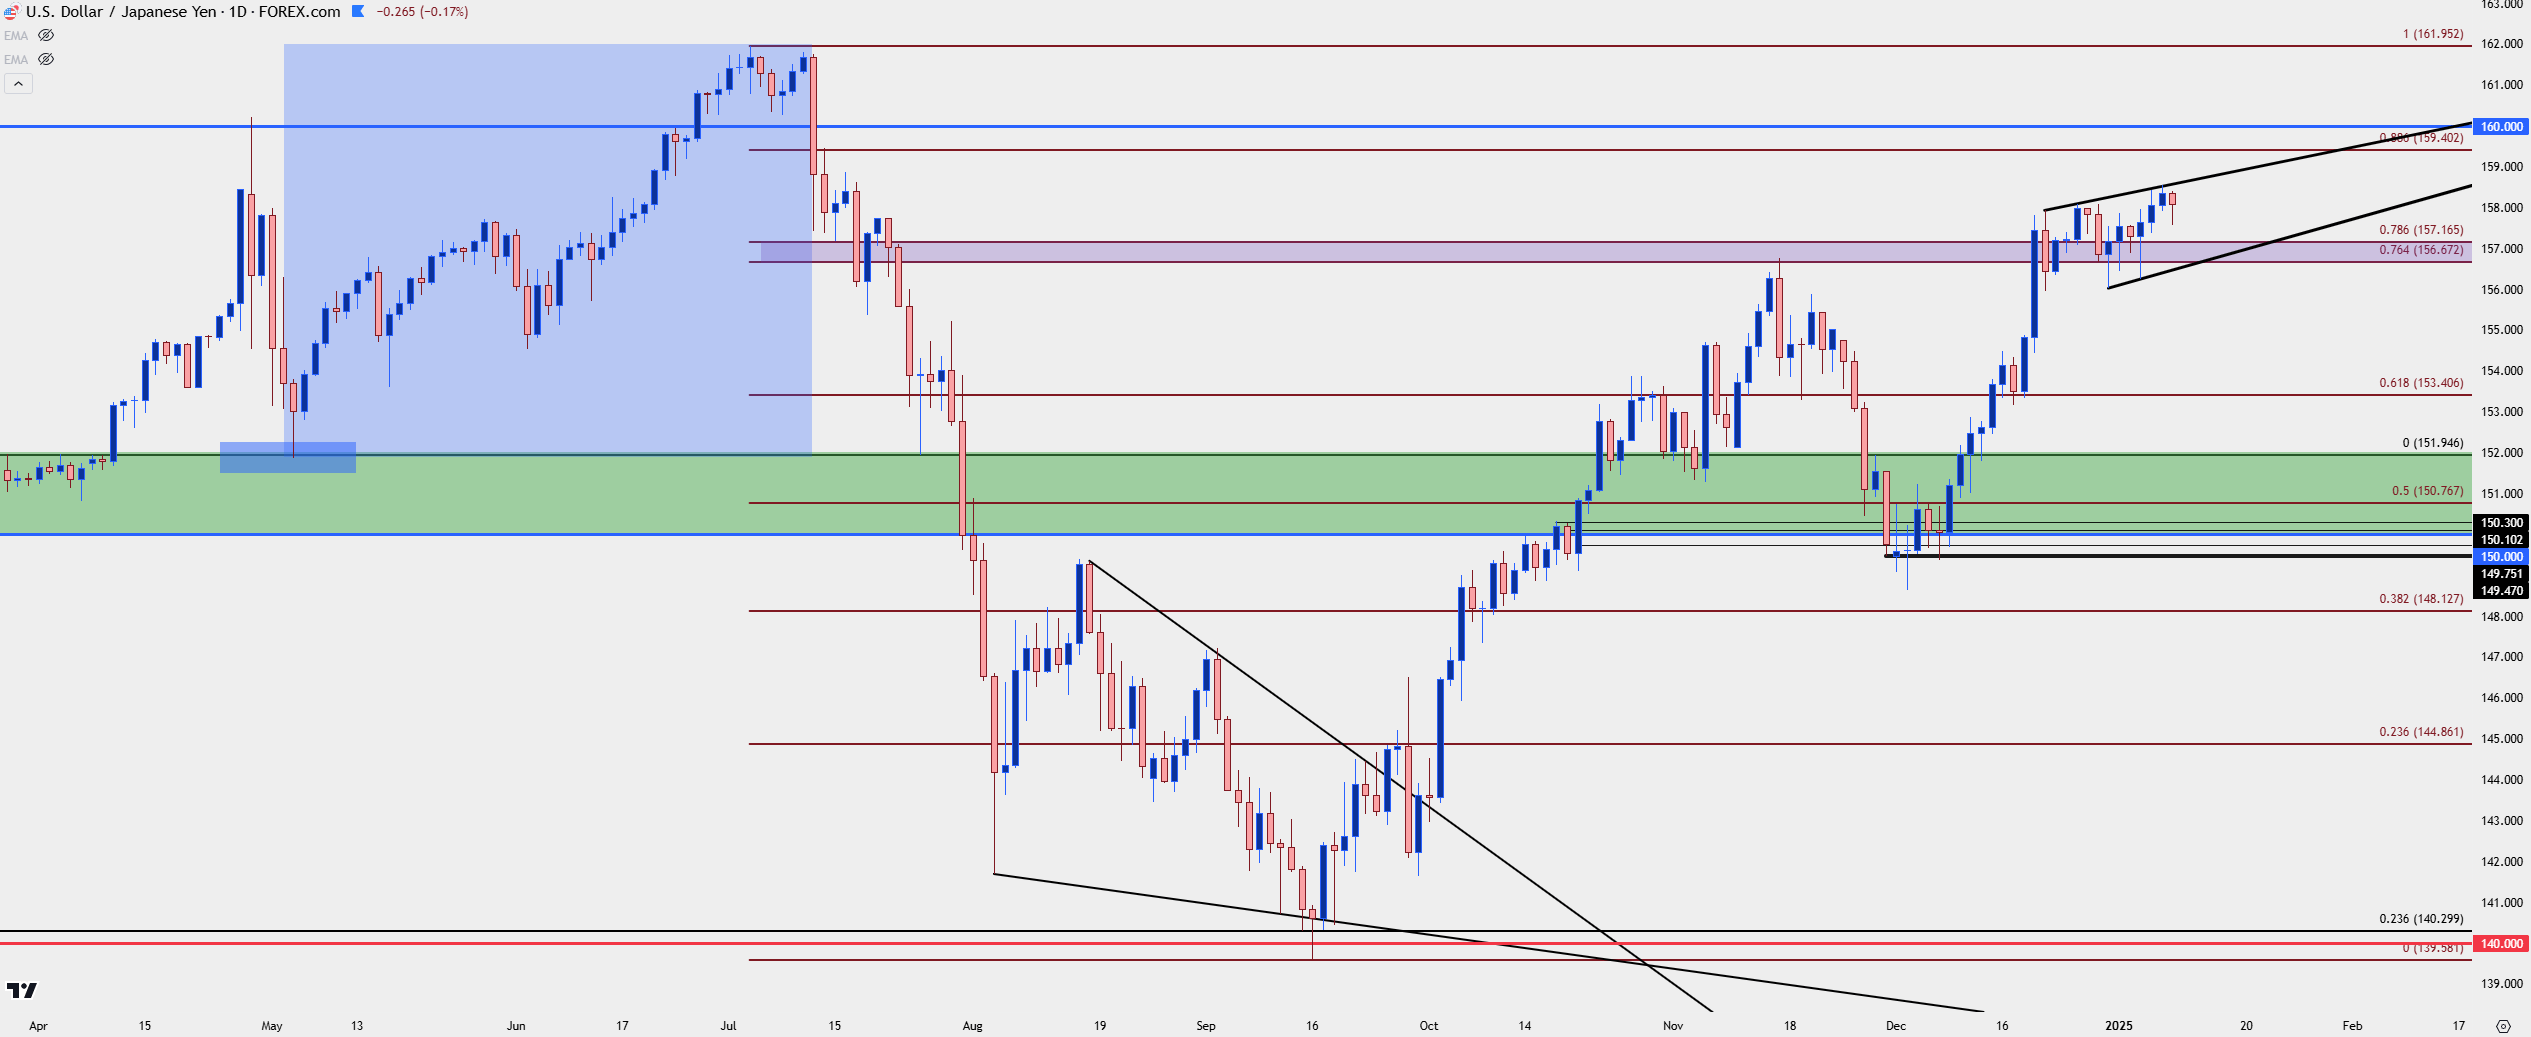
USD/JPY bulls have continued to claw back losses from the July-August sell-off in the pair and the month of December was another positive outlay for buyers. The BoJ seemed in no hurry to hike and the Fed sounded less enthusiastic about rate cuts. Around that FOMC rate decision in the middle of last month, USD/JPY spiked to a fresh five-month-high while testing above the 156.67-157.17 zone of Fibonacci resistance.
It's been a grinding few weeks since then, but on net this could still be qualified as bullish as prices have set both higher-highs and higher-lows, with that former area of resistance now showing as support.
USD/JPY Daily Price Chart
 Chart prepared by James Stanley, USD/JPY on Tradingview
USD/JPY Shorter-Term
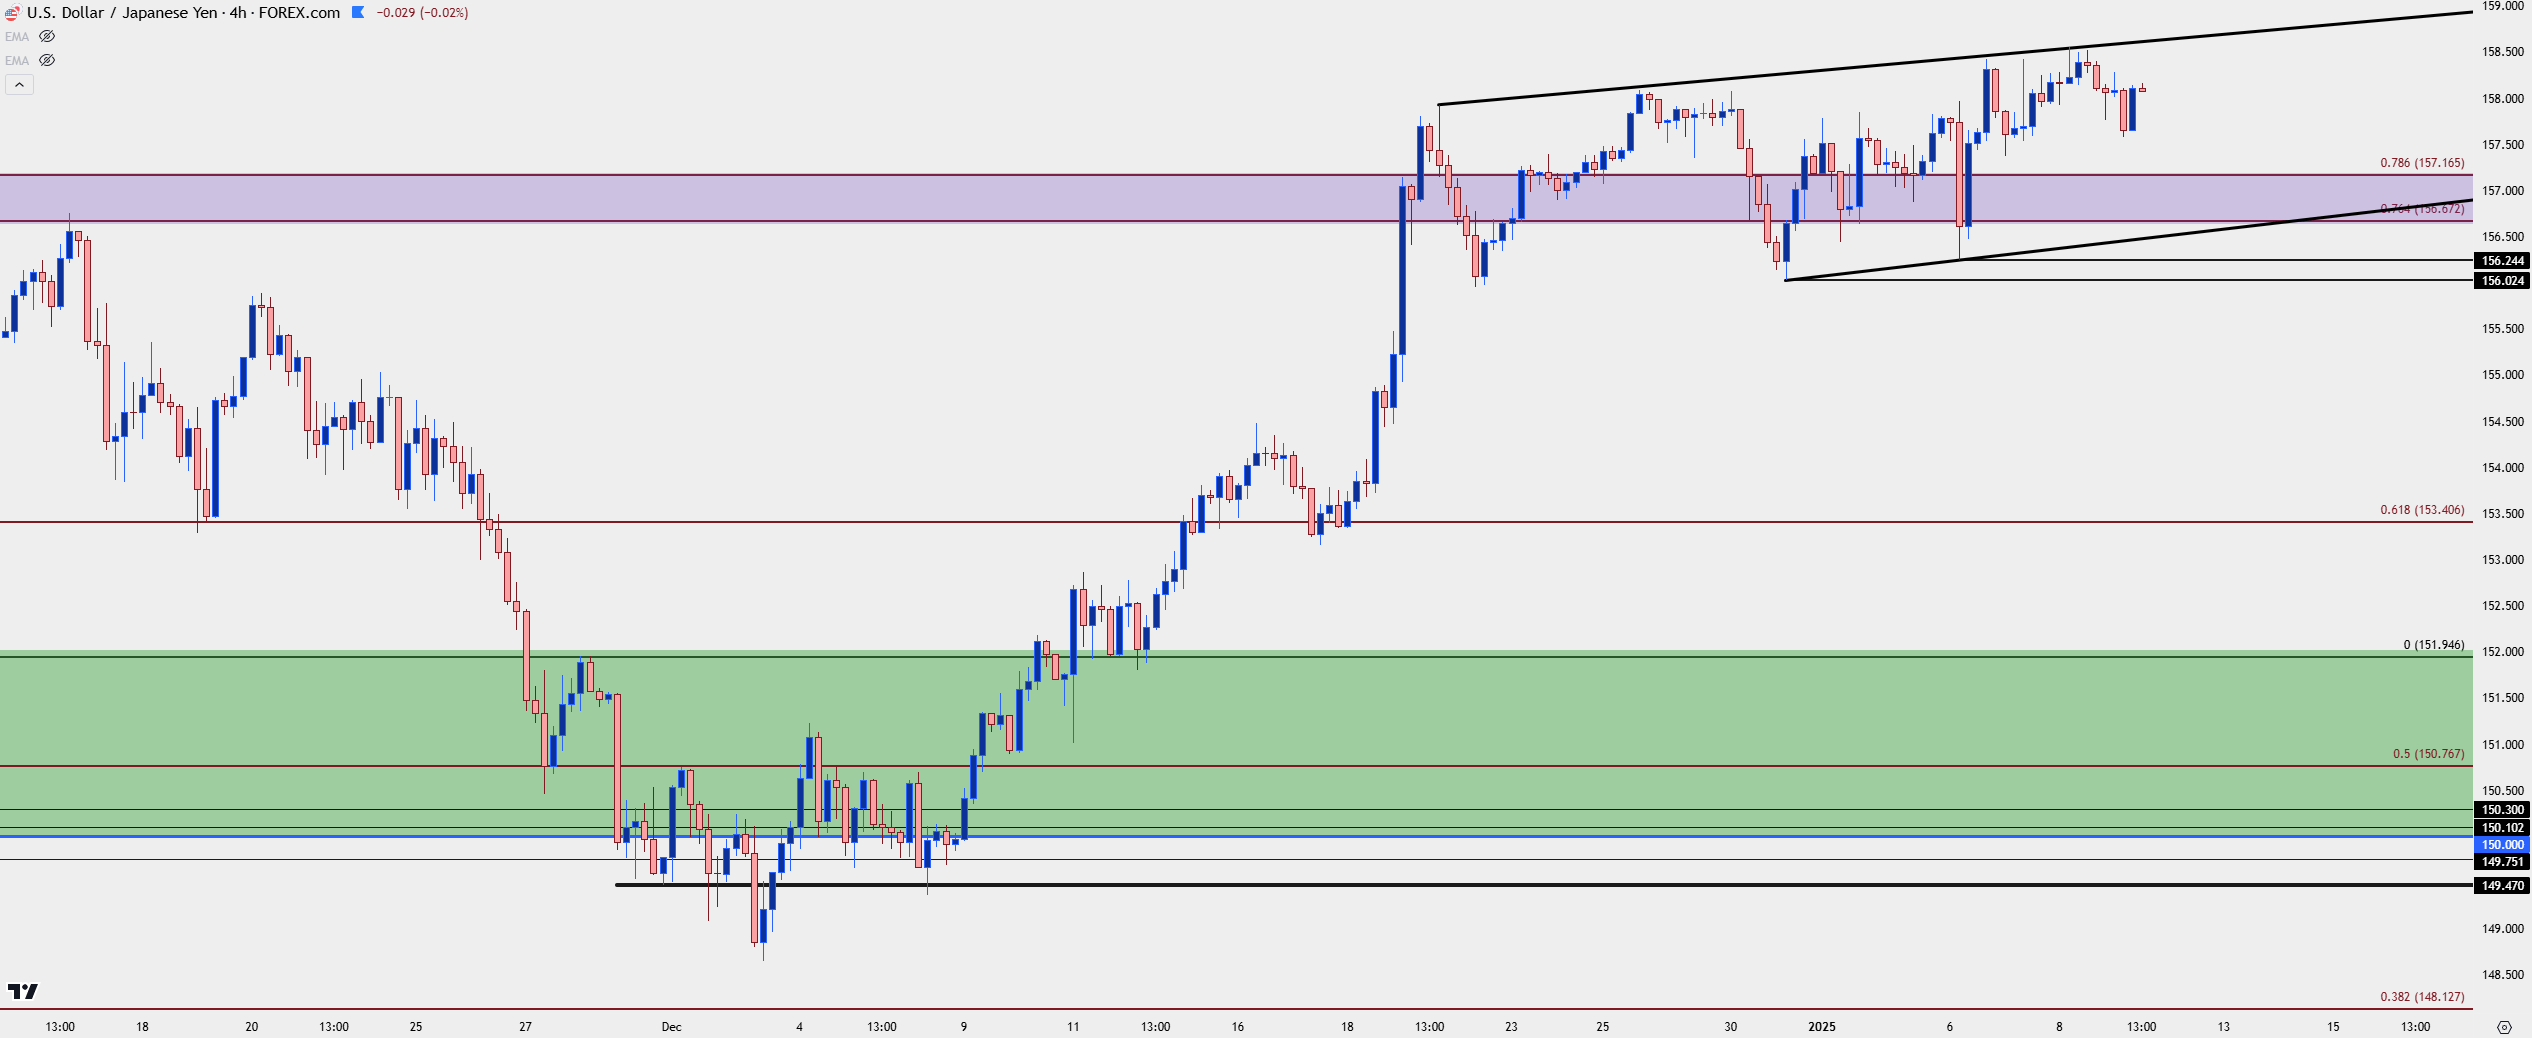
From the four-hour chart we can see that up-trend slowing; but it does still retain a topside bias given the continued higher-highs and lows. Given the swing lows from the past two weeks at 156.02 and 156.24, there’s also higher-low support potential remaining in the longer-term zone mentioned previously, spanning from 156.67-157.17.
USD/JPY Four-Hour Chart
 Chart prepared by James Stanley, USD/JPY on Tradingview
USD/JPY Bigger Picture, Key Resistance
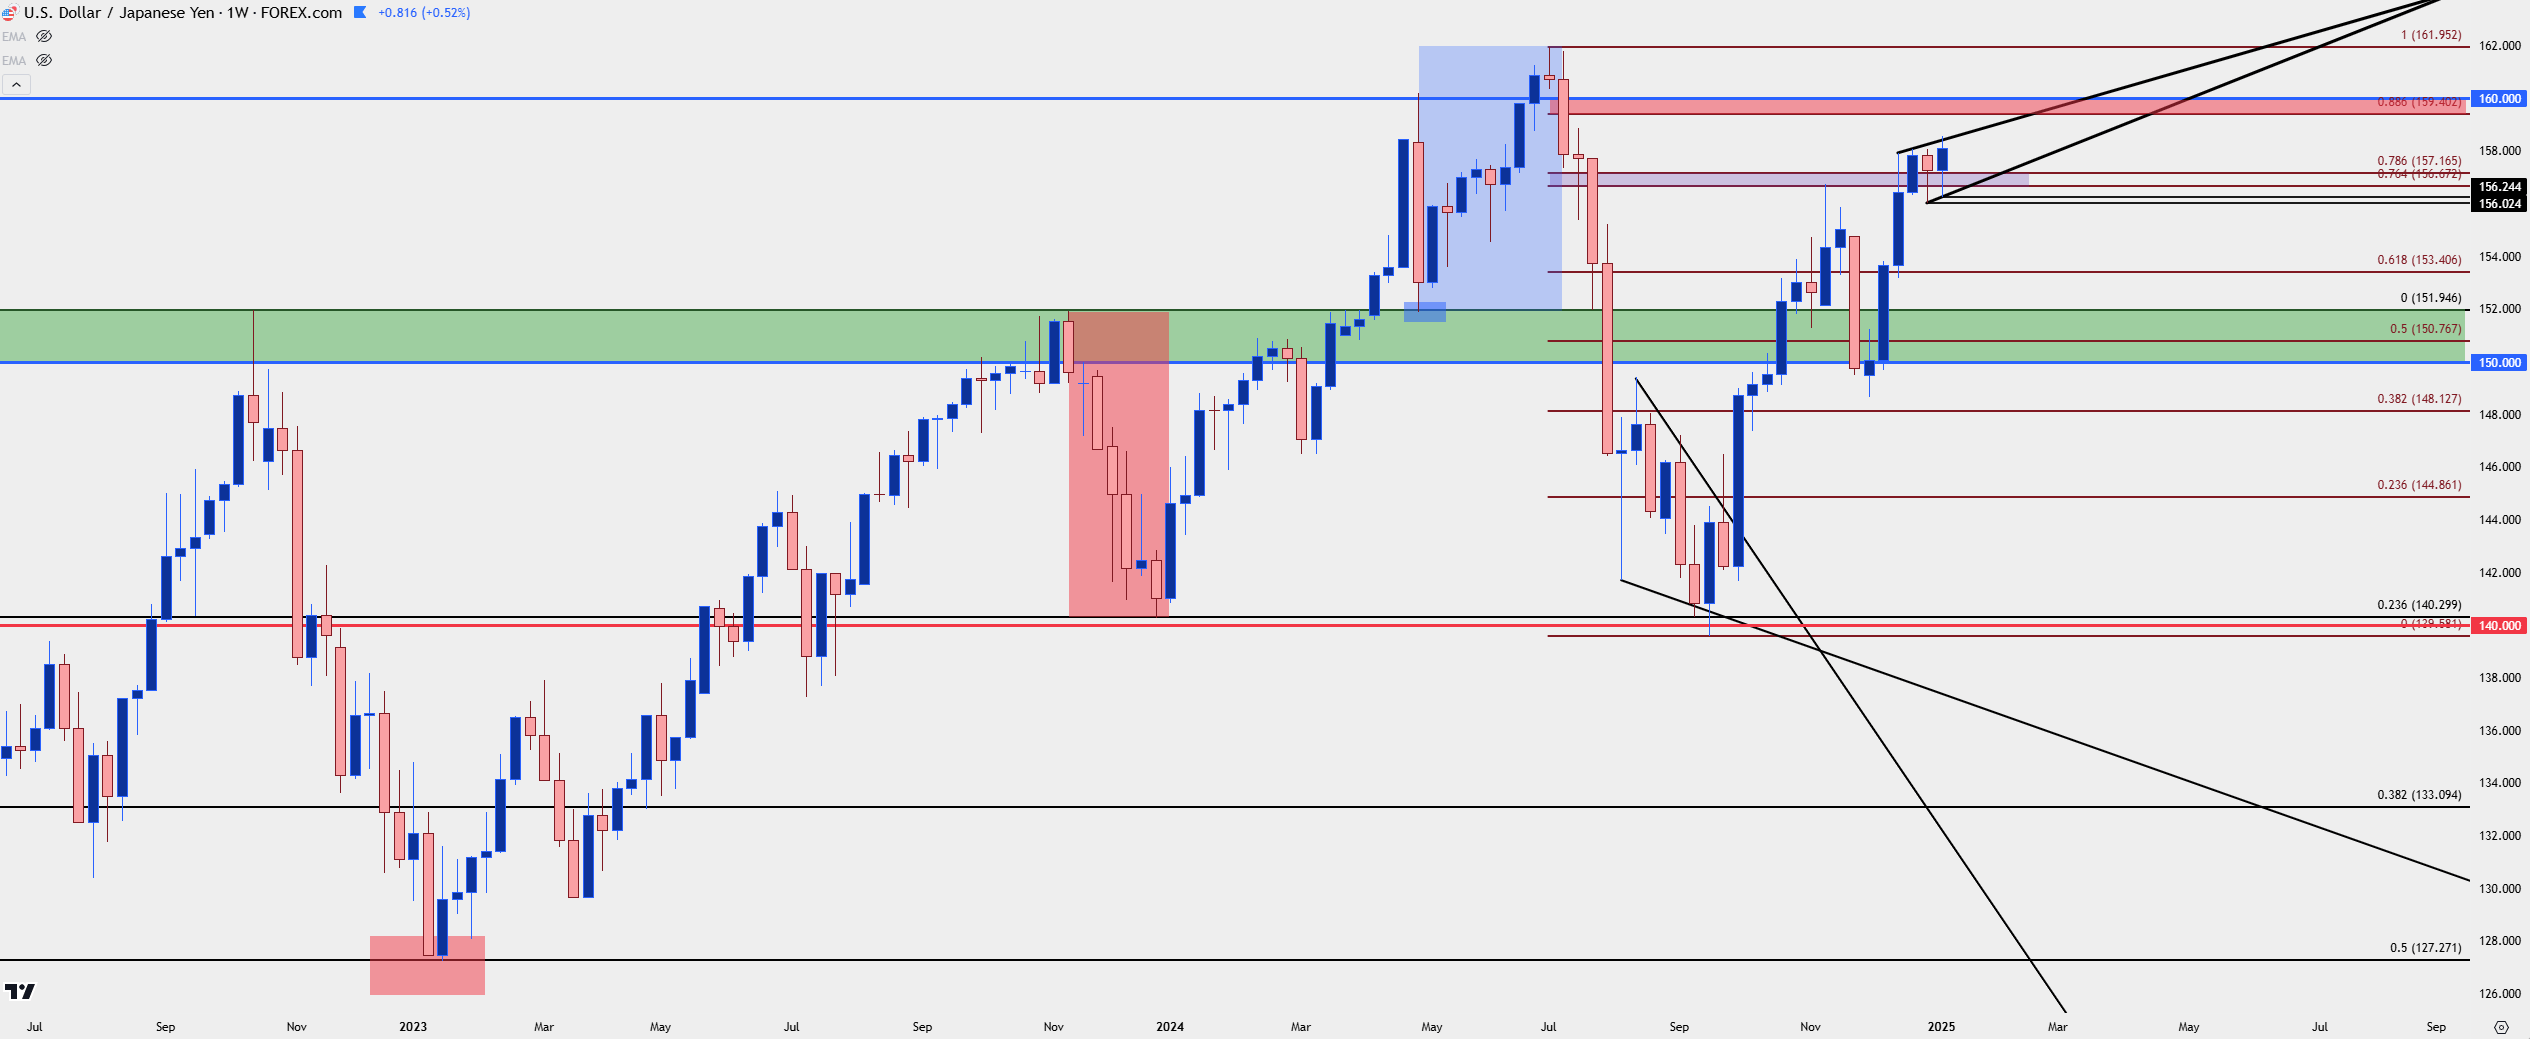
If we do see USD/JPY bulls continuing the run, the next major resistance zone sitting overhead has some historical scope. It was the 160.00 level that was defended by the Bank of Japan in late-April last year. And then this was the price that the pair had crossed in late-June and early-July before the bank ultimately intervened again.
That zone represents a big spot on the chart, and this is something that can go along with wider USD themes. If buyers stumble at that 160.00 resistance in USD/JPY, that can begin to open the door for mean-reversion themes. With NFP tomorrow and CPI on Wednesday, that scenario is of interest, particularly if we see USD data come out with any element of softness.
USD/JPY Weekly Price Chart
 Chart prepared by James Stanley, USD/JPY on Tradingview
--- written by James Stanley, Senior Strategist