*Note: This report was written before the US NFP data was published*
- US30 ends 2024 almost 13% higher, flat YTD
- Index on breakout watch ahead of US CPI & big bank earnings
- JPMorgan & Goldman Sachs make up nearly 12% of weighting
- Over past year, US CPI triggered ↑ 0.5% & ↓ 0.8%
- Technical levels – 43450 & 41800
High-risk events could shake FXTM’s US30 out of slumber next week.
Despite ending last year almost 13% higher, the index is practically flat year-to-date with prices trapped within a range.
Note: FXTM’s US30 tracks the benchmark Dow Jones Industrial Average index.
Key data including the US CPI report and earnings announcements from big US banks may provide fresh trading opportunities:
Monday, 13th January
- CN50: China trade
Tuesday, 14th January
- AU200: Australia consumer confidence
- JP225: Japan current account, Bank of Japan Deputy Governor Ryozo Himino speaks
- USDInd: US PPI, speeches by New York Fed President John, Kansas City Fed President Jeffrey Schmid
Wednesday, 15th January
- CAD: Canada manufacturing sales
- EUR: Eurozone industrial production
- GBP: UK CPI
- US500: Empire manufacturing, Citigroup, Wells Fargo, BlackRock earnings
- US30: US December CPI, JPMorgan Chase, Goldman Sachs earnings
Thursday, 16th January
- AU200: Australia unemployment
- CAD: Canada housing starts
- GER40: Germany CPI
- JP225: Japan PPI
- GBP: UK industrial production
- US500: US initial jobless claims, retail sales, Bank of America, Morgan Stanley earnings
- TWN: Taiwan Semiconductor Manufacturing Company (TSMC) earnings
Friday, 17th January
- CN50: China GDP, property prices, retail sales, industrial production
- EUR: Eurozone CPI
- GBP: UK retail sales
- SG20: Singapore trade
- USDInd: US housing starts, industrial production
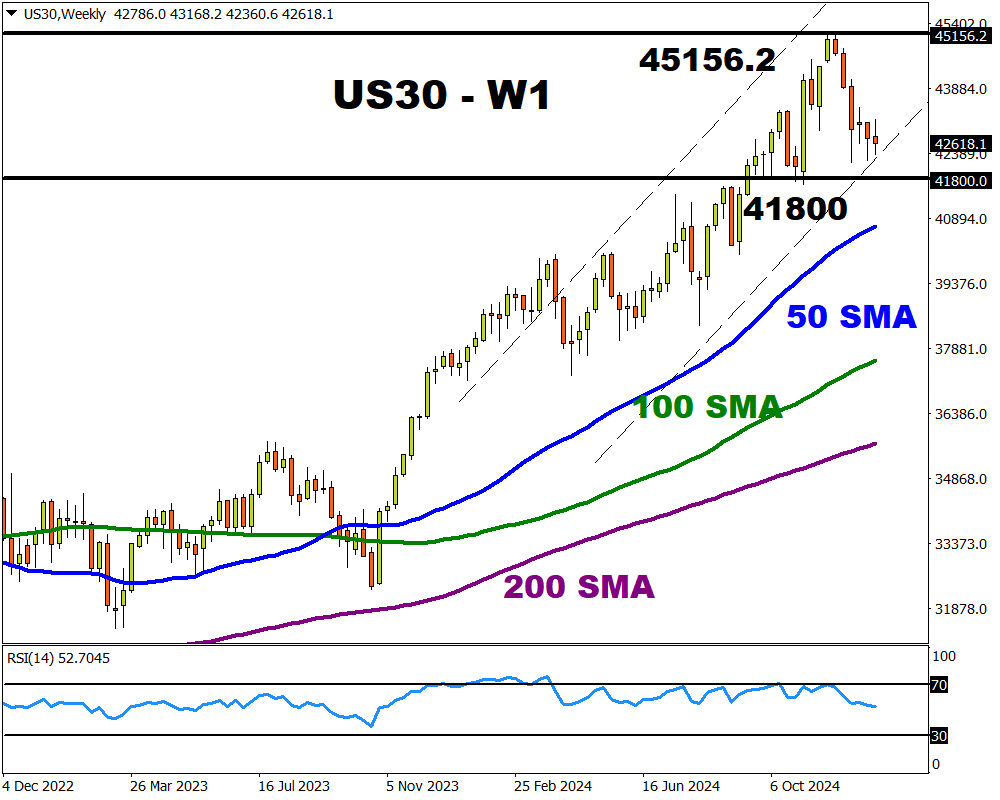
The US30 has posted five consecutive weeks of losses with prices roughly 6% away from the all-time high at 45156.2. However, prices remain in the bullish channel with key support at 41800.

Here are 3 factors that may trigger price swings in the week ahead:
1) American bank earnings
Fourth quarter earnings season unofficially kicks off on Wednesday 15th January, led by the biggest US banks. Heavyweights such as JPMorgan, Goldman Sachs, Citigroup and Wells Fargo among others will be in focus.
JPMorgan Chase – the largest US bank could provide insight into how Fed rate cuts impacted American banks in Q4.
So, all eyes will be on the net interest income (NII) – what the bank earns of loans and what it pays on deposits.
Note: Lower interest rates could reduce the net interest income, impacting earnings as a result.
It is worth noting the Federal Reserve cut interest rates by 50 basis points in Q4 2024, adding to the 50-basis point rate cut in September.
The consensus estimate for NII is around $22.9 billion in Q4 and $92.5 billion for 2024.
FXTM’s US30 could see heightened levels of volatility as financials make up almost 25% of its weighting with JPMorgan Chase & Goldman Sachs accounting for almost 12%.
Markets are forecasting a 3.2% move, either Up or Down, for JPMorgan Chase stocks on Wednesday post-earning.
2) US December CPI report – Wednesday 15th Jan
The incoming US Consumer Price Index (CPI) may influence bets around Fed cuts in 2025.
Markets are forecasting:
- CPI year-on-year (December 2024 vs. December 2023) to rise 2.9% from 2.7% in the prior month.
- Core CPI year-on-year to remain unchanged at 3.3%.
- CPI month-on-month (December vs November 2024) to remain unchanged at 0.3%.
Core CPI month-on-month to cool 0.2% from 0.3% in the prior month
Ultimately, signs of still sticky inflation may push back bets around the Fed cutting interest rates.
Note: Speeches from Fed officials and other key data may influence the US30 before/after the US inflation data on Wednesday.
Over the past 12 months, the US CPI report has triggered upside moves of as much as 0.5% of declines of 0.8% in a 6-hour window post-release.
3) Technical forces
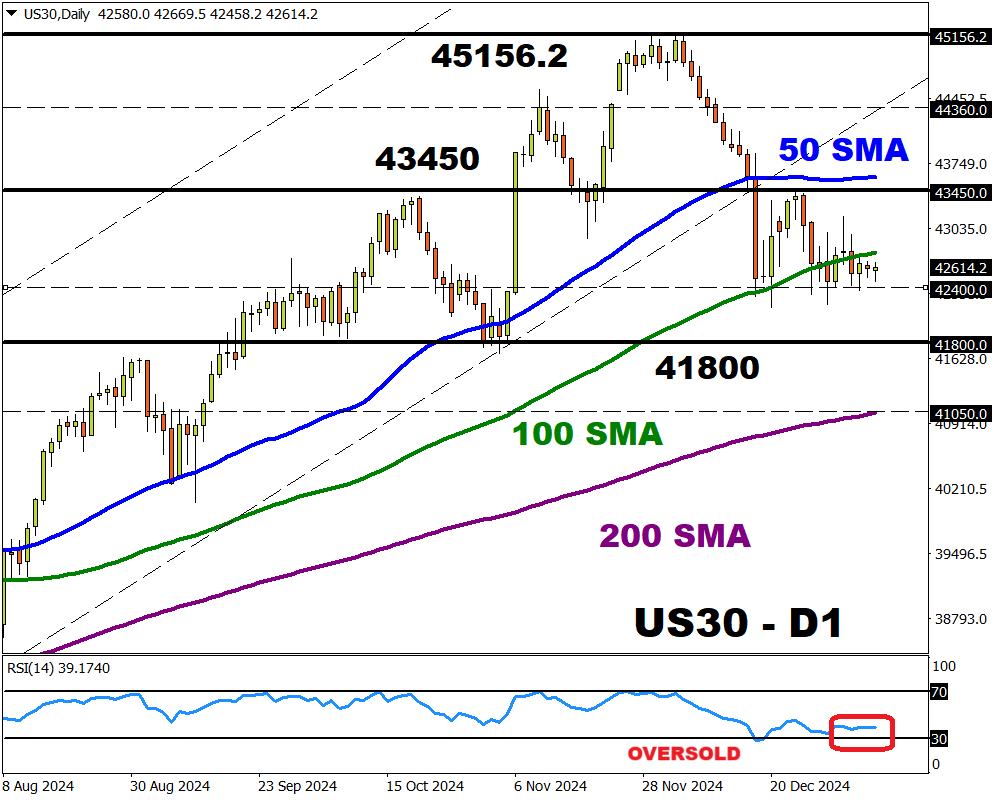
The US30 has breached the bullish channel on the daily charts with prices back within a range.
Although there is a bearish presence, the Relative Strength Index (RSI) is trading near oversold territory. Support can be found at 41800 and resistance at 43450.
- A solid breakout and daily close above 43450 may open a path toward 44360 and the all-time high at 45156.2.
- Should prices slip below 41800, this could trigger a decline toward the 200-day SMA at 41050.
