US Dollar Index Technical Forecast: USD Weekly Trade Levels (DXY)
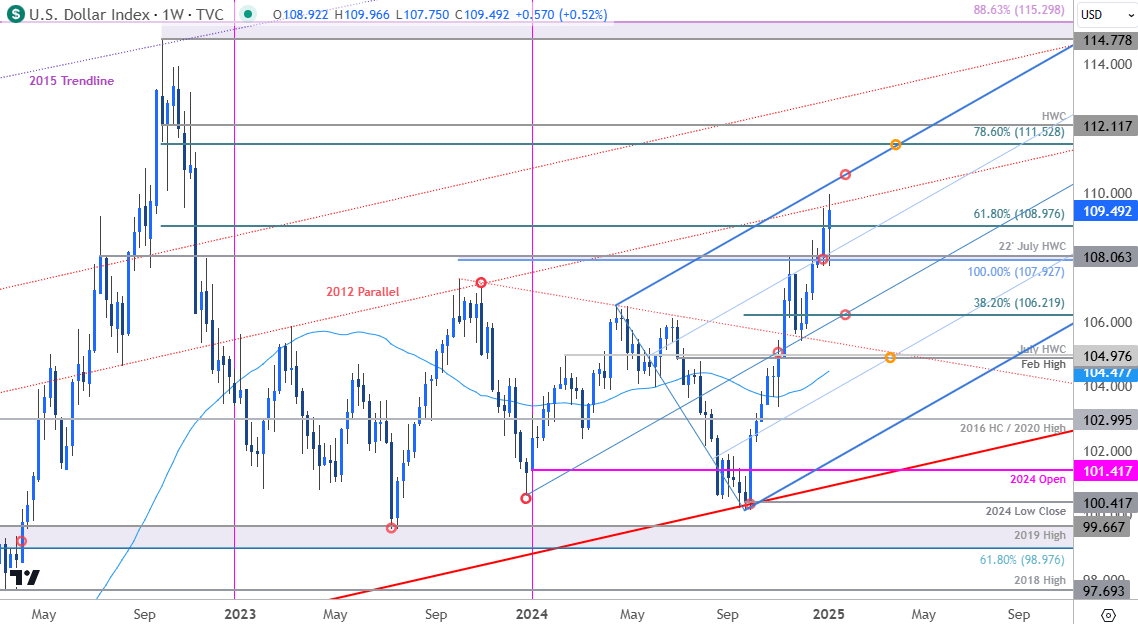
- US Dollar marks six-week rally to fresh yearly highs- bulls eye uptrend resistance
- USD weekly momentum threatens break into overbought territory- key inflation data on tap
- DXY Resistance 109.70s, 110.50s (key), 111.53-112.12– Support 107.93-108.06, 106.22 (key), 104.87/98
The US Dollar is poised to mark a sixth consecutive weekly advance with DXY breaking to fresh yearly highs into the start of 2025. The rally is now approaching longer-term uptrend resistance and the focus is on possible inflection into this slope. These are the updated targets and invalidation levels that matter on the DXY weekly technical chart post-NFPs.
Review my latest Weekly Strategy Webinar for an in-depth breakdown of this USD setup and more. Join live on Monday’s at 8:30am EST.US Dollar Price Chart – USD Weekly (DXY)

Chart Prepared by Michael Boutros, Sr. Technical Strategist; DXY on TradingView
Technical Outlook: In last month’s US Dollar Technical Forecast we noted that our focus was on a breakout of the December opening range and that, “losses should be limited to the median-line IF price is heading higher on this stretch with a close above 108.06 needed to mark uptrend resumption.” The index ripped through resistance into the close of the year with DXY rallying more than 4.3% off the December low. The advance is now extending into longer-term slope considerations at multi-year uptrend resistance and while the broader outlook remains constructive, the immediate advance may be vulnerable in the weeks ahead.
Initial slope resistance is being tested this week at the 2012 parallel (red) near ~109.70s and is backed closely by pitchfork resistance (blue) near ~110.50s. Both slopes have the potential to interrupt the December advance. The next major technical consideration is eyed at 111.53-112.12- a region defined by the 78.6% retracement of the 2022 decline and the objective 2022 high-week close (HWC). Look for a larger reaction there IF reached.
Initial weekly support now rests back at 107.93-108.06 with bullish invalidation now raised to the 38.2% retracement of the September advance at 106.21. Note that the median-line converges on this threshold over the next few weeks and a break / close below would be needed to suggest a more significant high is in place / larger reversal is underway towards 104.87/98.

Bottom line: The six-week rally takes the US Dollar towards uptrend resistance early in the month. From a trading standpoint, look to reduce long-exposure / raise protective stops on a rally towards the upper parallel- losses should be limited to this week’s low IF price is heading higher on this stretch with a close above pitchfork resistance needed to fuel the next major leg of the advance.
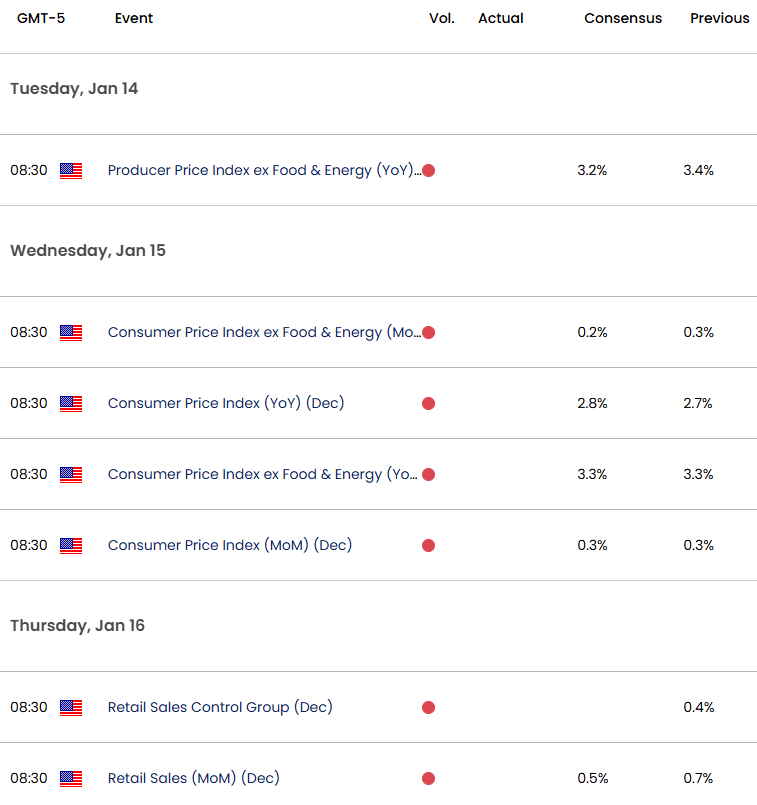
Keep in mind we get the release of key inflation data next week with the U.S. Consumer Price Index on tap Wednesday. Stay nimble into the release and watch the weekly closes here for guidance. Review my latest US Dollar Short-term Outlook for closer look at the near-term DXY technical trade levels.
Key Economic Data Releases

Economic Calendar - latest economic developments and upcoming event risk.
Active Weekly Technical Charts
- Australian Dollar (AUD/USD)
- Swiss Franc (USD/CHF)
- Euro (EUR/USD)
- Crude Oil (WTI)
- Gold (XAU/USD)
- Japanese Yen (USD/JPY)
- Canadian Dollar (USD/CAD)
- British Pound (GBP/USD)
--- Written by Michael Boutros, Sr Technical Strategist
Follow Michael on X @MBForex