Article Outline
- Key Events: Chinese Data, OPEC Monthly Report, US CPI, and Winter Demand
- Technical Analysis: USOIL (3-Day Time Frame)
- Technical Analysis (TA) Tip: RSI Patterns
Oil’s 2025 Uptrend
The 2025 uptrend for crude oil was fueled initially by expectations of Chinese economic growth, further supported by a sharp increase in winter fuel demand. Oil prices climbed back toward October 2024 highs after stronger-than-expected non-farm payroll results on Friday, which added 256,000 jobs and amplified inflation concerns for 2025.
Next week’s U.S. CPI data is expected to influence oil market volatility further, with implications for Fed rate expectations and monetary policy in 2025. Positive oil hedges remain tied to unresolved geopolitical factors, Chinese economic metrics, and reports from OPEC and the IEA.

OPEC Monthly Report
The first monthly oil reports for 2025 are set to be released this week, following the December 2024 Monthly Oil Market Report (MOMR), which reduced the 2025 demand growth forecast to 1.45 million barrels per day (bpd). This revision reflected weaker demand in China and the Middle East.
However, the outlook for 2025 could shift with potential Middle Eastern reforms and notable Chinese economic stimulus. More data on geopolitical resolutions and China’s economic metrics is required to support a more optimistic forecast. The current sentiment remains cautious, with upside potential dependent on key levels and the materialization of these resolutions.
Chinese Economic Data
New Chinese loan data, expected between January 13 and 15, hovers near decade lows as markets await signs of improvement. Foreign Direct Investments, also scheduled for next week, are similarly weak, near 2009 levels, with critical hopes for recovery. Loan prime rates are expected on January 20, coinciding with Trump’s return to the White House.
The People’s Bank of China (PBOC) announced moderately loose monetary policies for 2025, and their implementation will be closely monitored alongside loan prime rates. Significant stimulus or improvement in Chinese economic conditions could further bolster oil market gains, while continued stagnation may align with oil’s 2-year bearish trend.
Technical Analysis: Quantifying Uncertainties
Crude Oil Week Ahead: 3-Day Time Frame

Source: Tradingview
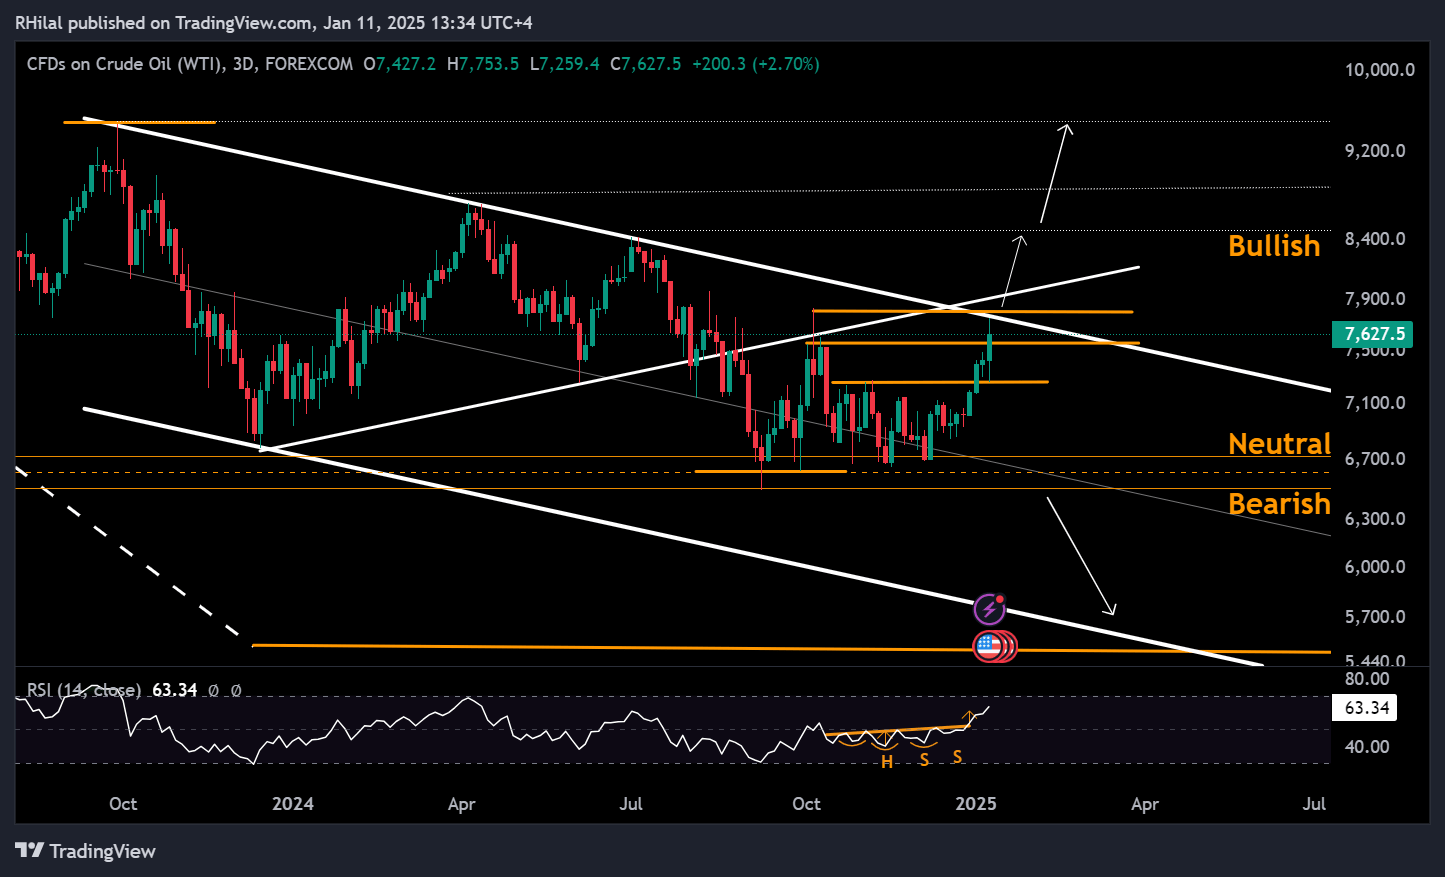
Oil prices recently retested the upper border of the down trending channel at the $77.50 high following stronger-than-expected U.S. non-farm payroll data. As long as prices remain below the triangle pattern and within the down trending channel, the outlook remains neutral to bearish.
A firm close above $78.30 could strengthen bullish sentiment, potentially driving oil prices back into the $80 range, with key resistance levels at $84, $87, $90, and $95. On the downside, short-term support is near $72, with further support at $68 and $64. A confirmed bearish trend continuation could target lower levels around $55 and $49.
Economic developments in China and the U.S., alongside global geopolitical factors, remain critical to determining oil’s directional sustainability. Policies stemming from Trump’s presidency and OPEC decisions carry significant weight, necessitating alignment among multiple factors for a clearer directional outlook.
Technical Analysis (TA) Tip: RSI Patterns
Crude Oil Week Ahead: 3-Day Time Frame

Source: Tradingview
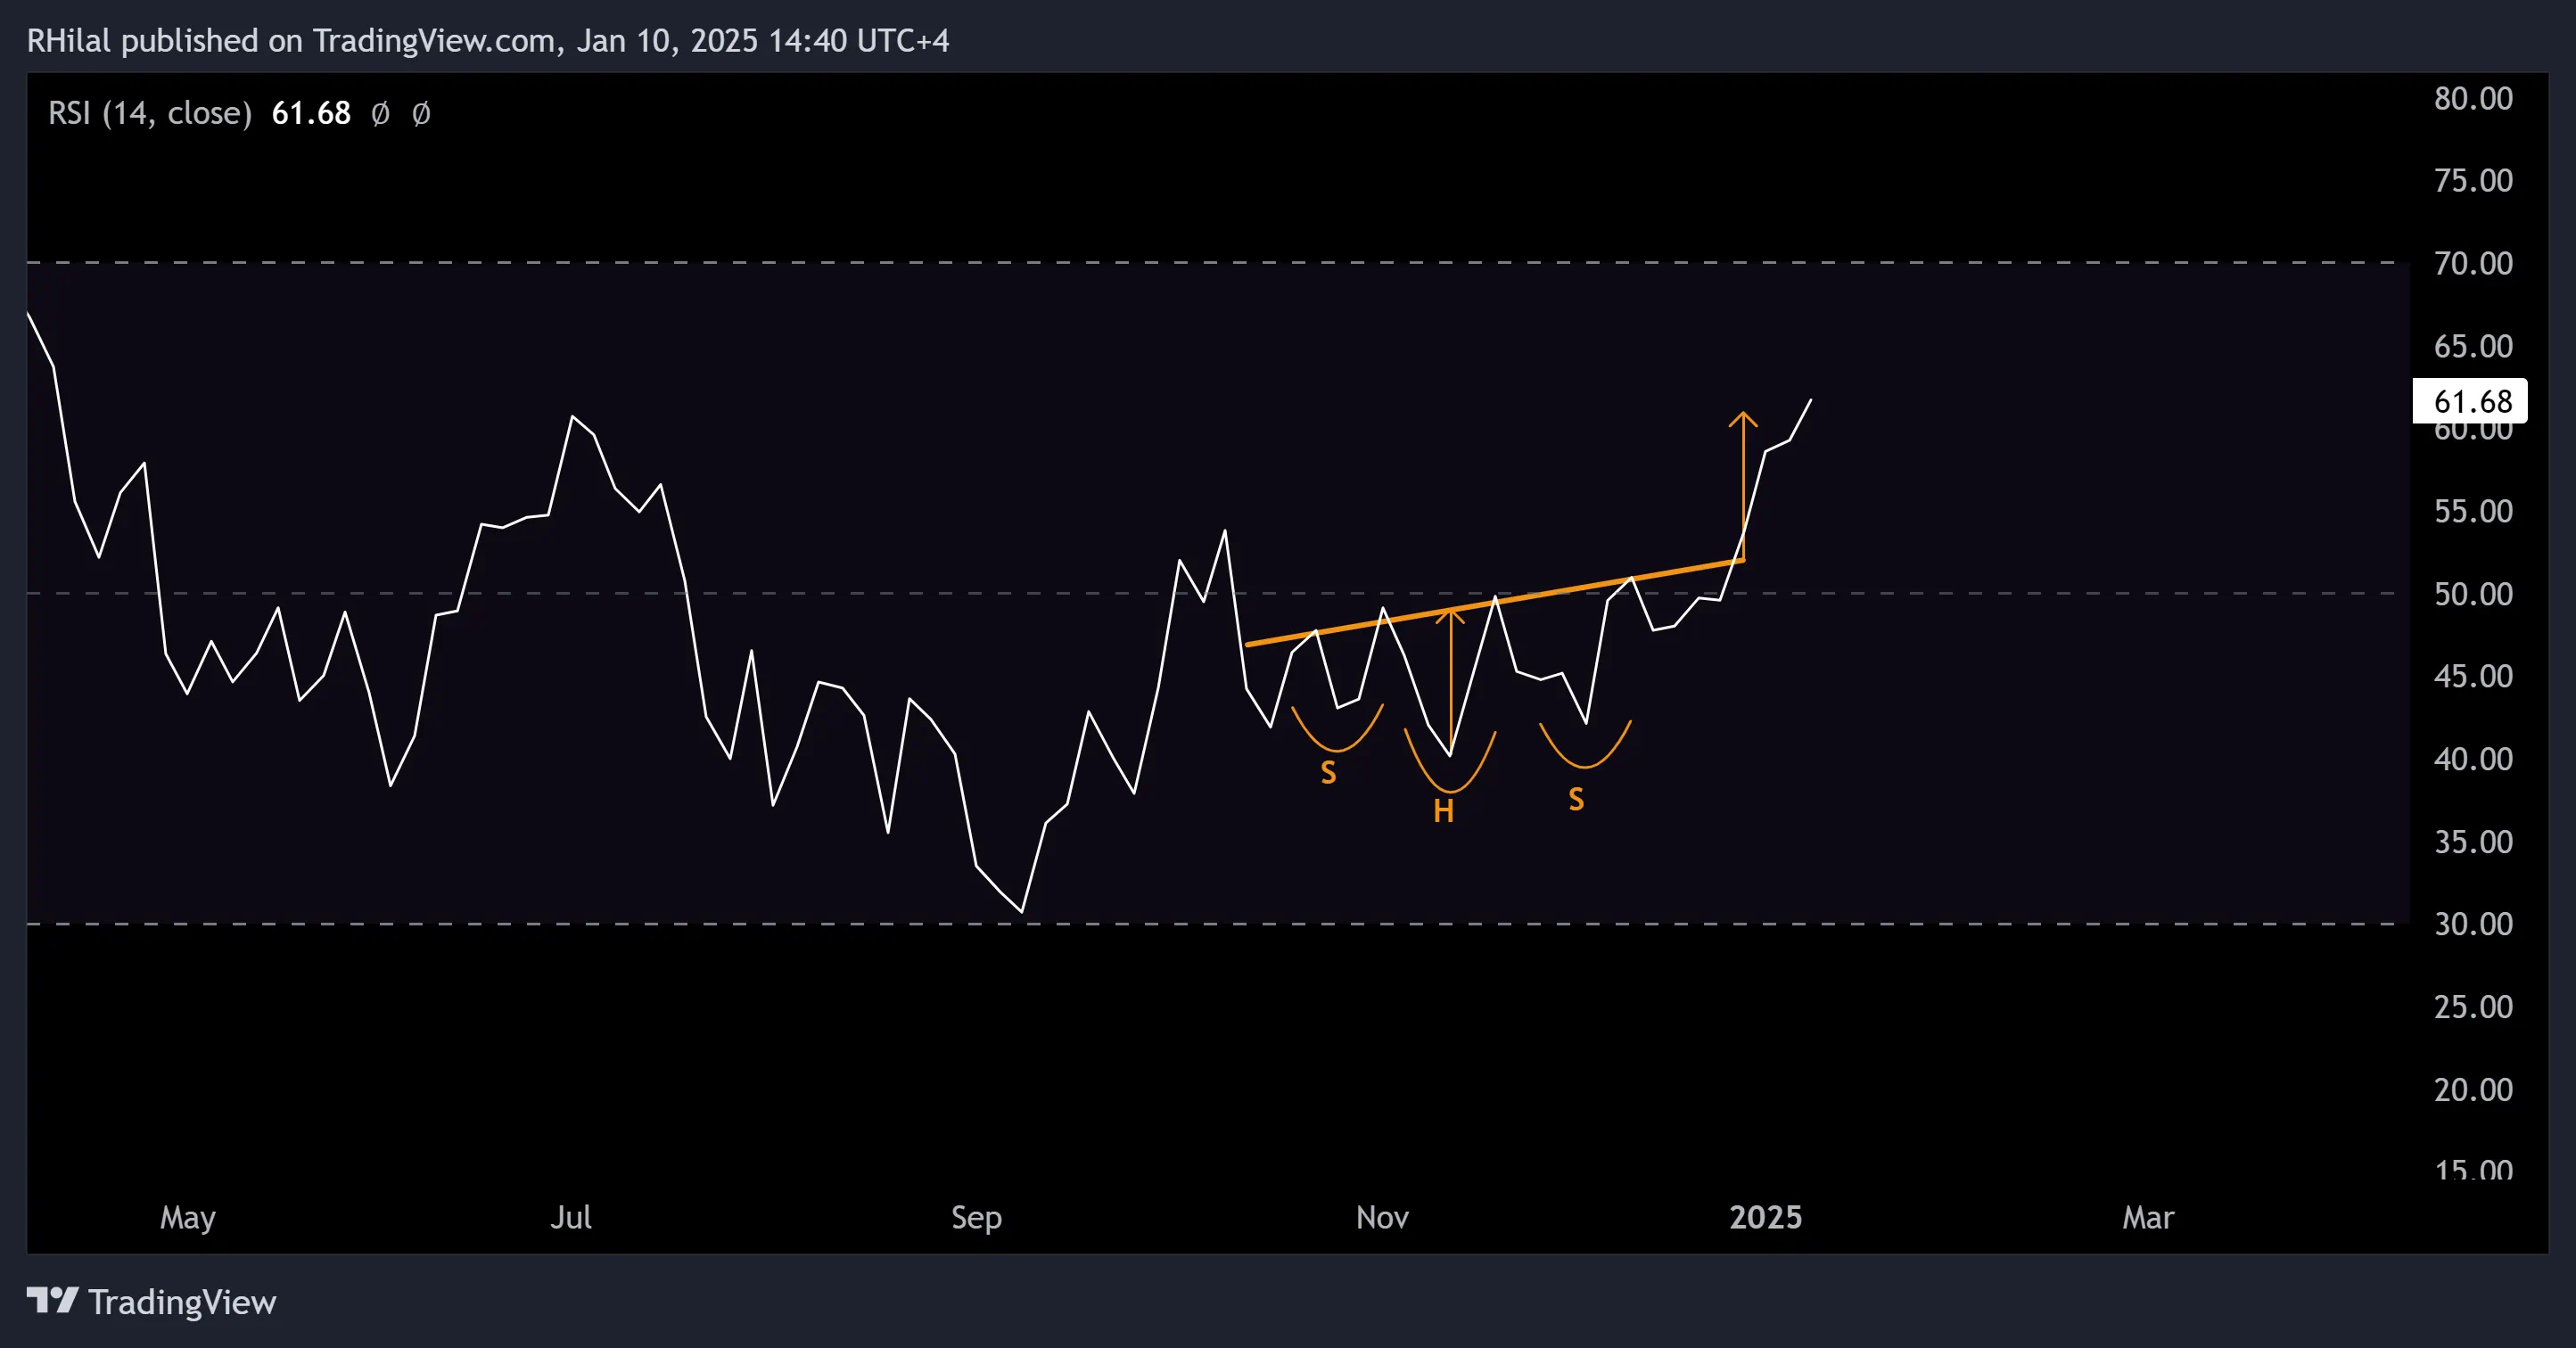
Similar to identifying chart patterns and establishing breakout directions and targets, RSI trends can offer valuable insights. Forecasting RSI trends helps predict momentum targets between extreme levels, reversals, and continuation patterns, providing an additional layer of analysis for market direction.
Example: the breakout from the inverted Head and Shoulders continuation pattern on the RSI aligned with the oil’s 2025 uptrend towards October 2024 highs near 78$ per barrel.
Written by Razan Hilal, CMT
Follow on X: @Rh_waves
You Tube: Forex.com