US CPI KEY TAKEAWAYS:
- US CPI expectations: 2.7% y/y headline inflation, 3.3% y/y core inflation
- The Fed is likely to remain on hold for the next several months regardless of this month’s CPI reading, with a hotter-than-expected print potentially prompting traders to price out any rate cuts in 2025.
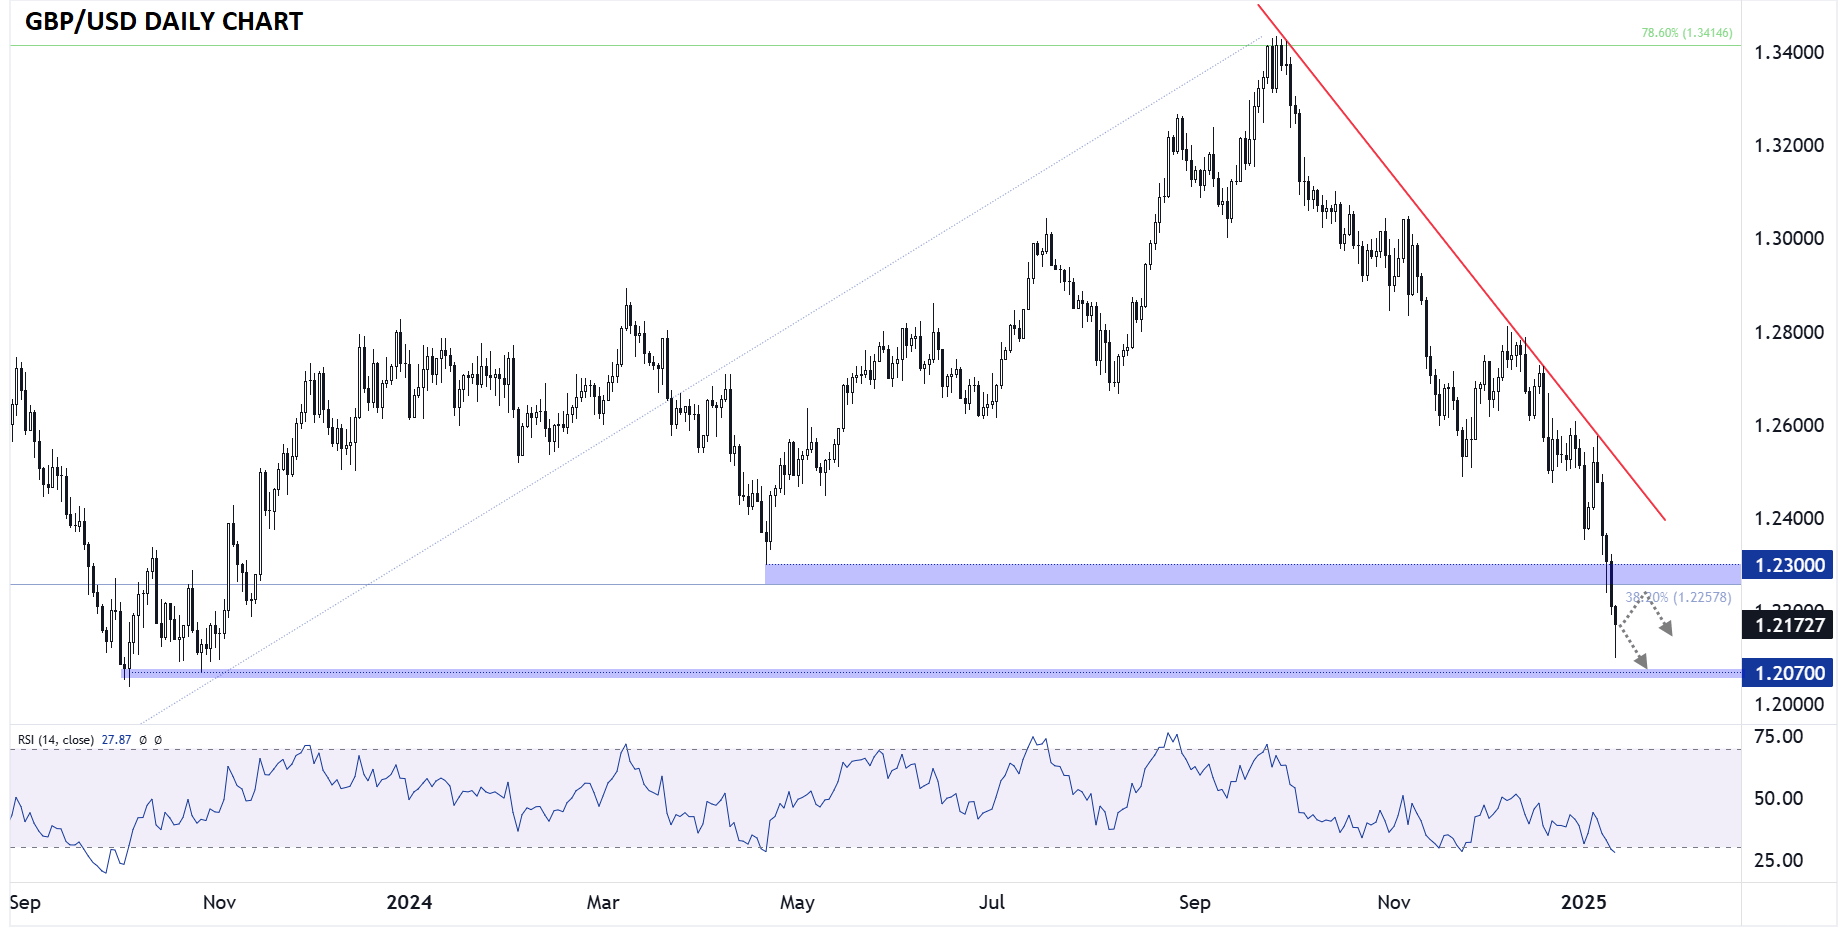
- GBP/USD’s trend is undeniably bearish, but the RSI is testing its most oversold levels in nearly a year, hinting at an elevated chance of a bounce
When is the US CPI report?
The US CPI report for December will be released at 8:30ET (13:30 GMT) on Wednesday, January 15.
What are the US CPI Report Expectations?
Traders and economists are projecting headline CPI to come in at 2.7% y/y, with the core (ex-food and -energy) reading expected at 3.3% y/y.
US CPI Forecast
Economic data is interesting for economists, but for traders, it’s only interesting insofar as it impacts markets. For that, we have to consider the “transmission mechanism” between the data and market movements: central bank policy.
The Fed, as always, is focused on both maintaining full employment (based on Friday’s NFP report, the Fed seems to be doing a decent job here) and inflation, which has stubbornly stalled in the 3% range after a steep decline in 2022 and 2023.
With the labor market remaining strong and inflation still (slightly) above the Fed’s target, it’s not surprising that traders are pushing out prospects of another interest rate cut from the Fed toward the latter half of the year; accordingly, the volatility around this week’s inflation reading may be more limited than in the past, as the Fed will, in all likelihood, still get another handful of inflation (and jobs) reports before making any additional changes to interest rates.
That said, a pickup in price pressures could lead traders to start asking whether the Fed’s interest rate cutting cycle may be completed already, complicating the path forward for a central bank that has clearly been hinting that the easing cycle isn’t done yet.
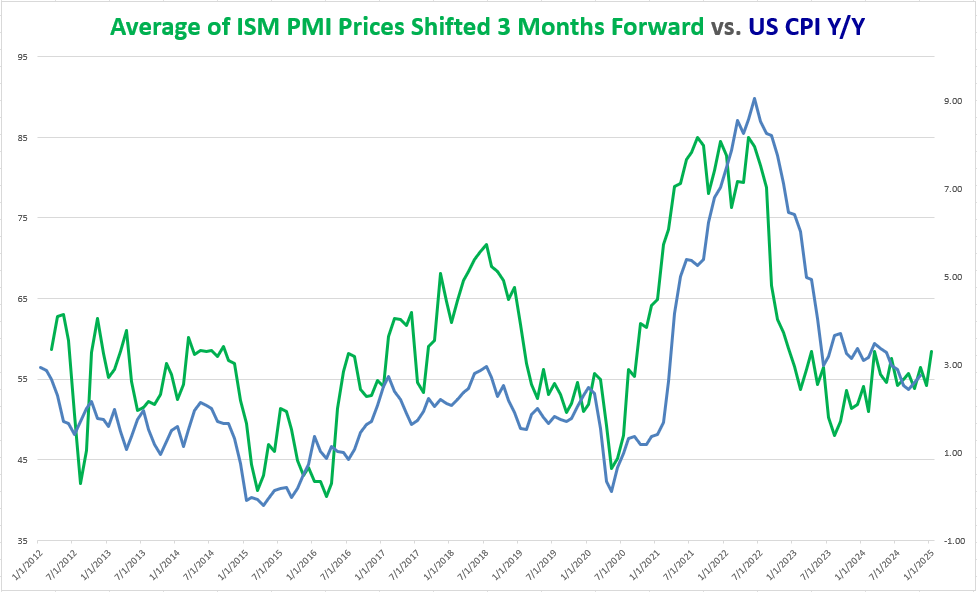
As many readers know, the Fed technically focuses on a different measure of inflation, Core PCE, when setting its policy, but for traders, the CPI report is at least as significant because it’s released weeks earlier. As the chart below shows, the year-over-year measure of US CPI has resumed its decline from the 2022 peak in recent months, though economists are expecting it to bump back up to 2.7% this month:

Source: TradingView, StoneX
As the chart above shows, the “Prices” component of the PMI reports has turned higher over the last month and may continue to rise if President-Elect Trump continues to emphasize protectionism and tariffs when he takes office.
Crucially, the other key component to watch when it comes to US CPI is the so-called “base effects,” or the influence that the reference period (in this case, 12 months) has on the overall figure. Last December’s 0.3% m/m reading will drop out of the annual calculation after this week’s print, opening the door for an decrease in the headline year-over-year CPI reading if the month-over-month reading is less than 0.3%.
US Dollar Technical Analysis – GBP/USD Daily Chart

One of the more noteworthy US dollar crosses in the current environment is GBP/USD, which is probing 14+ month lows under 1.2200 as we go to press. The trend in Cable is undeniably bearish, but the RSI is testing its most oversold levels in nearly a year, hinting at an elevated chance of a bounce if we see any half-decent UK (or less-than-stellar US) data. In that scenario, previous-support-turned-resistance in the 1.2260-1.2300 zone could cap rates, whereas a strong US inflation report could quickly take GBP/USD toward support in the 1.2050-70 area.
-- Written by Matt Weller, Global Head of Research
Check out Matt’s Daily Market Update videos on YouTube and be sure to follow Matt on Twitter: @MWellerFX