Article Outline
- Key Events: Chinese Metrics, Geopolitics, and Inflation
- Technical Analysis: XAUUSD, XAGUSD (3-Day Time Frames)
- Technical Analysis (TA) Tip: Noise Reduction
Intro
Gold’s extended triangle consolidation and silver’s repeated rebounds at critical support levels have signaled bullish trends on the charts. These bullish grounds are driven by inflation concerns, geopolitical uncertainties, and advancements in China’s economic data.
Chinese Economy Update
China’s latest economic data has supported gold’s upward trajectory, emphasizing the positive correlation between China’s growth and gold purchases:
• New Loans: Increased from 580B to 990B, reaching a 3-month high
• Trade Balance: Surged to a 10-month high with a surplus of 753B
However, much of the positive export data is attributed to a frontload of shipments ahead of anticipated U.S. tariffs under Trump’s administration. This geopolitical backdrop, coupled with trade war risks, has bolstered gold’s safe-haven appeal.
Key Chinese metrics to watch this week include GDP, industrial production, retail sales, and FDI reports, all scheduled for Friday. These indicators will offer further insight into China’s economic strength and its impact on commodity demand.

US Inflation and Global Currency Risks
Positive non-farm payroll results have intensified inflation concerns and US CPI data delivered mixed signals, pushing the DXY to mark a resistance at the 110 mark and pressure global currencies to critical lows. Gold remains on an upward trajectory, benefiting from its inflation-hedging properties, until key support levels are breached.
Technical Analysis: Quantifying Uncertainties
Gold Forecast: 3-Day Time Frame – Log Scale

Source: Tradingview
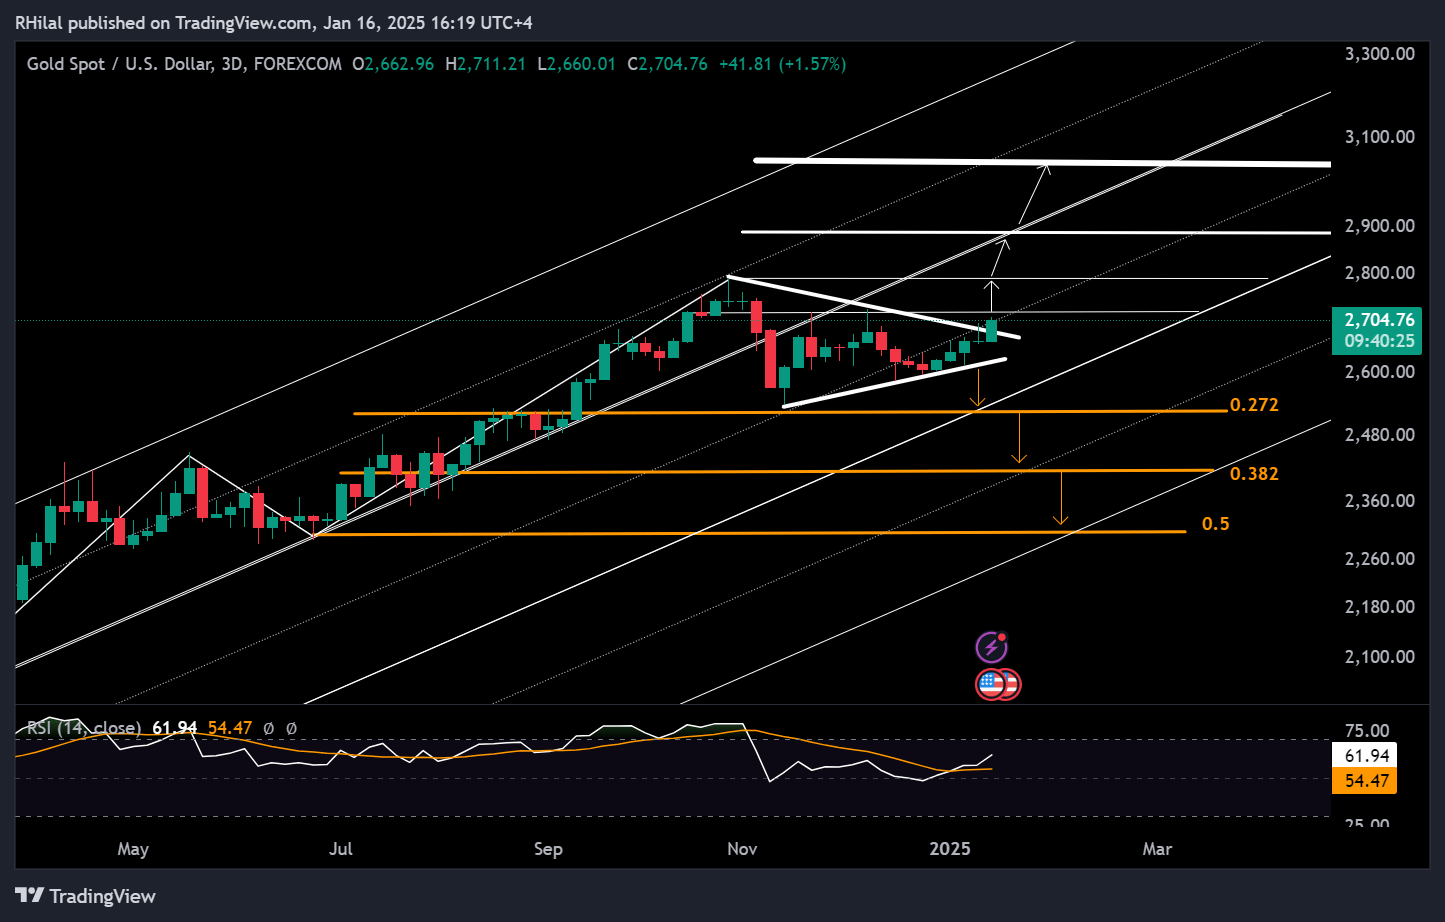
Gold’s extended triangle formation, spanning December 2024 to January 2025 within the $2,500 to $2,700 price zones, has broken positively above $2,700. This move aligns with a rebounding 3-day Relative Strength Index (RSI) from neutral levels and above its moving average.
Key Levels to Watch
Upside: $2,730 and $2,800 are the next resistance levels in line, with extended bullish scenarios aiming for $2,890 and $3,050
Downside: The upper boundary of the triangle, now at $2,680–$2,660, serves as potential support and a key reversal zone
Further declines could test support levels at $2,580 and $2,520 before signaling a deeper bearish scenario.
Silver Forecast: 3 Day Time Frame – Log Scale

Source: Tradingview
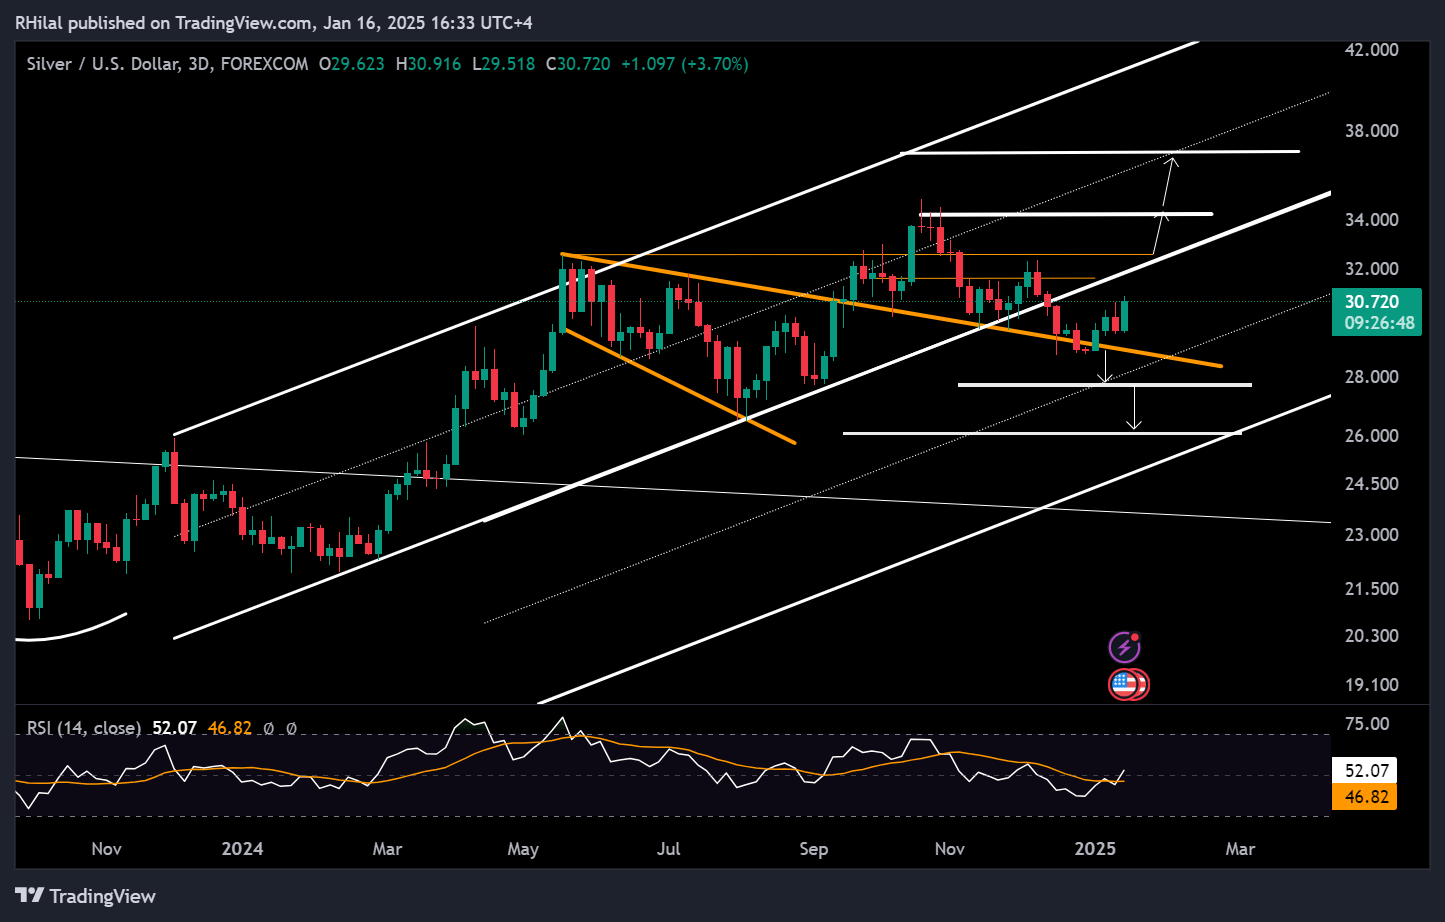
Silver recently slipped below the $30 mark and the boundaries of its year-long primary uptrending parallel channel. However, it held support at the trendline connecting highs and lows from May 2024 to January 2025.
Key Levels to Watch
• Upside: A confirmed uptrend requires moves toward $31.60 and $32.60, with extended bullish scenarios targeting $37 and $40.
• Downside: A close below $28.70 could extend bearish scenarios to $27.70, with critical support at $26.
Technical Analysis (TA) Tip: Noise Reduction
Reducing chart noise is essential for identifying reliable patterns. Using 3-day time frames helps minimize noise, providing a clearer perspective on trends and their respective rebounds. The higher the time frame, the simpler and more comprehensible the chart becomes, allowing for better trend analysis and decision-making.
Written by Razan Hilal, CMT
Follow on X: @Rh_waves
On You tube: Forex.com