Article Outline
- Key Events: Trump Returns, UK employment data, PMIs, and Netflix earnings
- Technical Analysis: GBPUSD and Dow (3-Day Time Frames)
- Technical Analysis (TA) Tip: Market Noise and Shadows
Inauguration Day
As Trump returns to his market seat, the market is closely monitoring policy announcements and potential unpredictability regarding taxes, immigration, government spending, tariffs, and cryptocurrencies.


Economic Calendar
- Tuesday: UK Claimant Count Change: GBP volatility risk
- Friday: Flash Manufacturing and Services (PMI Indicators): GBP and USD volatility risk
- Wednesday: Netflix results (US indices volatility risk)
Technical Analysis: Quantifying Uncertainty
GBPUSD Forecast: 3-Day Time Frame – Log Scale

Source: Tradingview
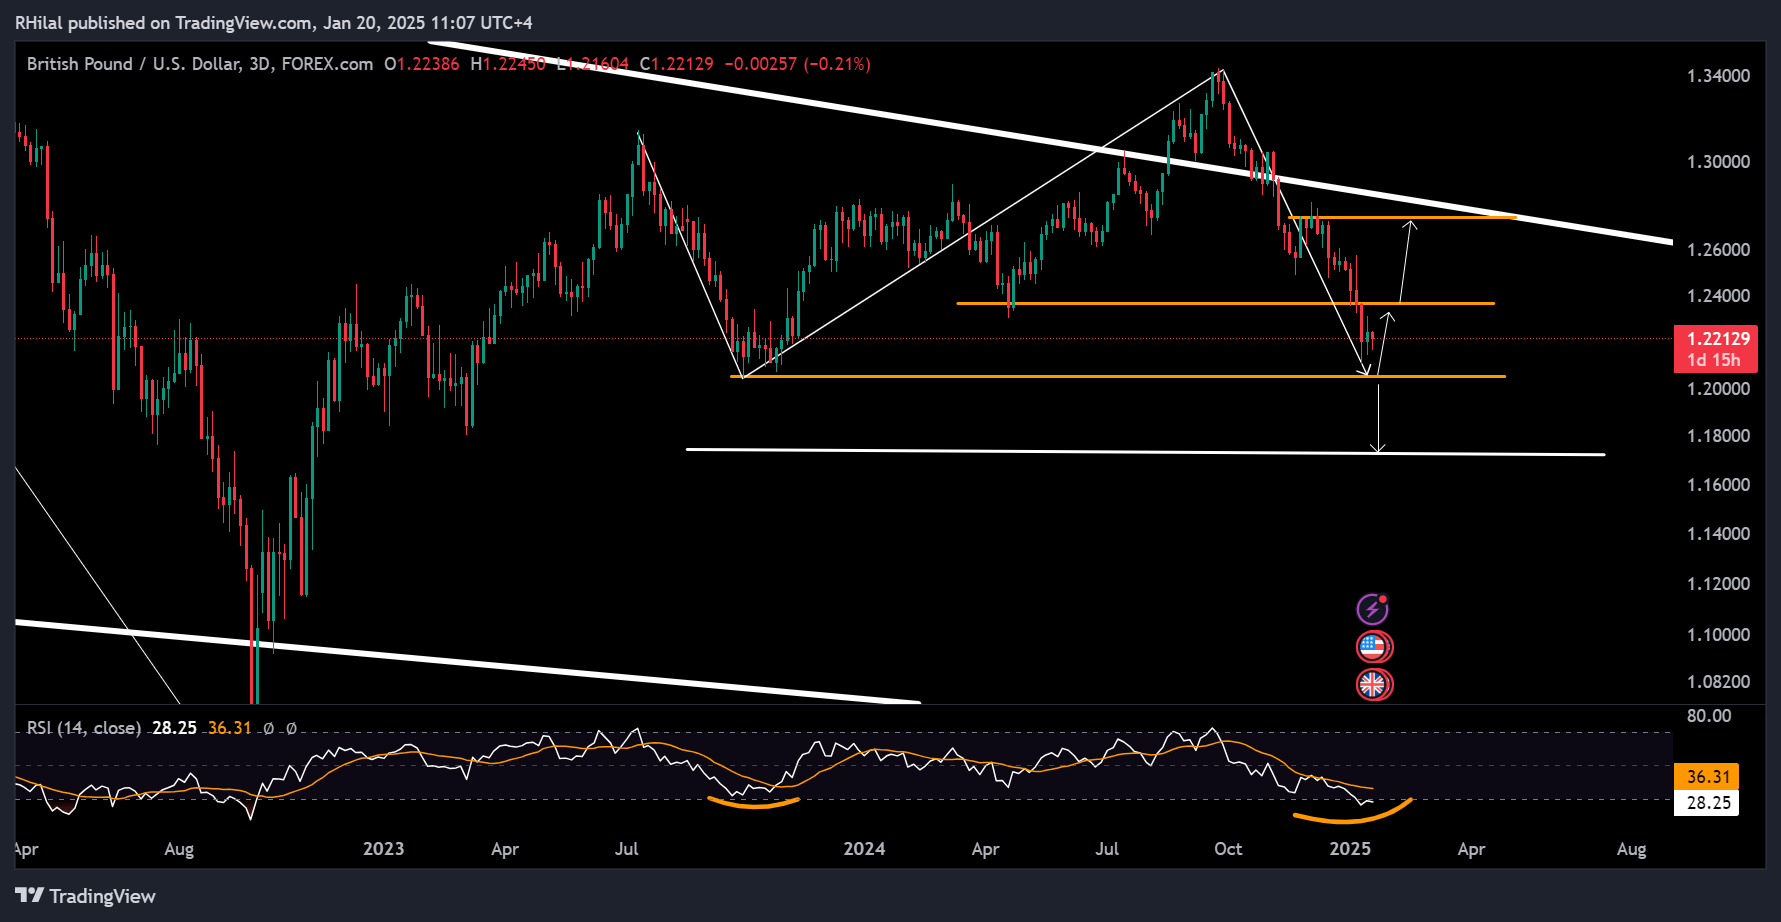
Breaking below the 2024 low at 1.2330, GBP/USD accelerated its decline toward the October 2023 low at 1.2030. Extreme conditions on the chart emphasize the importance of the following support levels, particularly the 1.272 Fibonacci extension, drawn from the July 2023 high (1.3125), October 2023 low (1.2030), and September 2024 high (1.3434).
These levels align with previously observed oversold conditions on the Relative Strength Index (RSI) in October 2023 and September 2022. If the current support holds, a potential reversal could push the pair back toward resistance levels at 1.2330 and 1.2770, coinciding with the upper border of the 15-year consolidation range.
Should bearish pressures persist below the critical 1.20 level, further declines could target the 1.5 and 1.618 Fibonacci extension levels, aligning with 1.18 and 1.1670, respectively.
Dow Jones Forecast: 3-Day Time Frame – Log Scale

Source: Tradingview
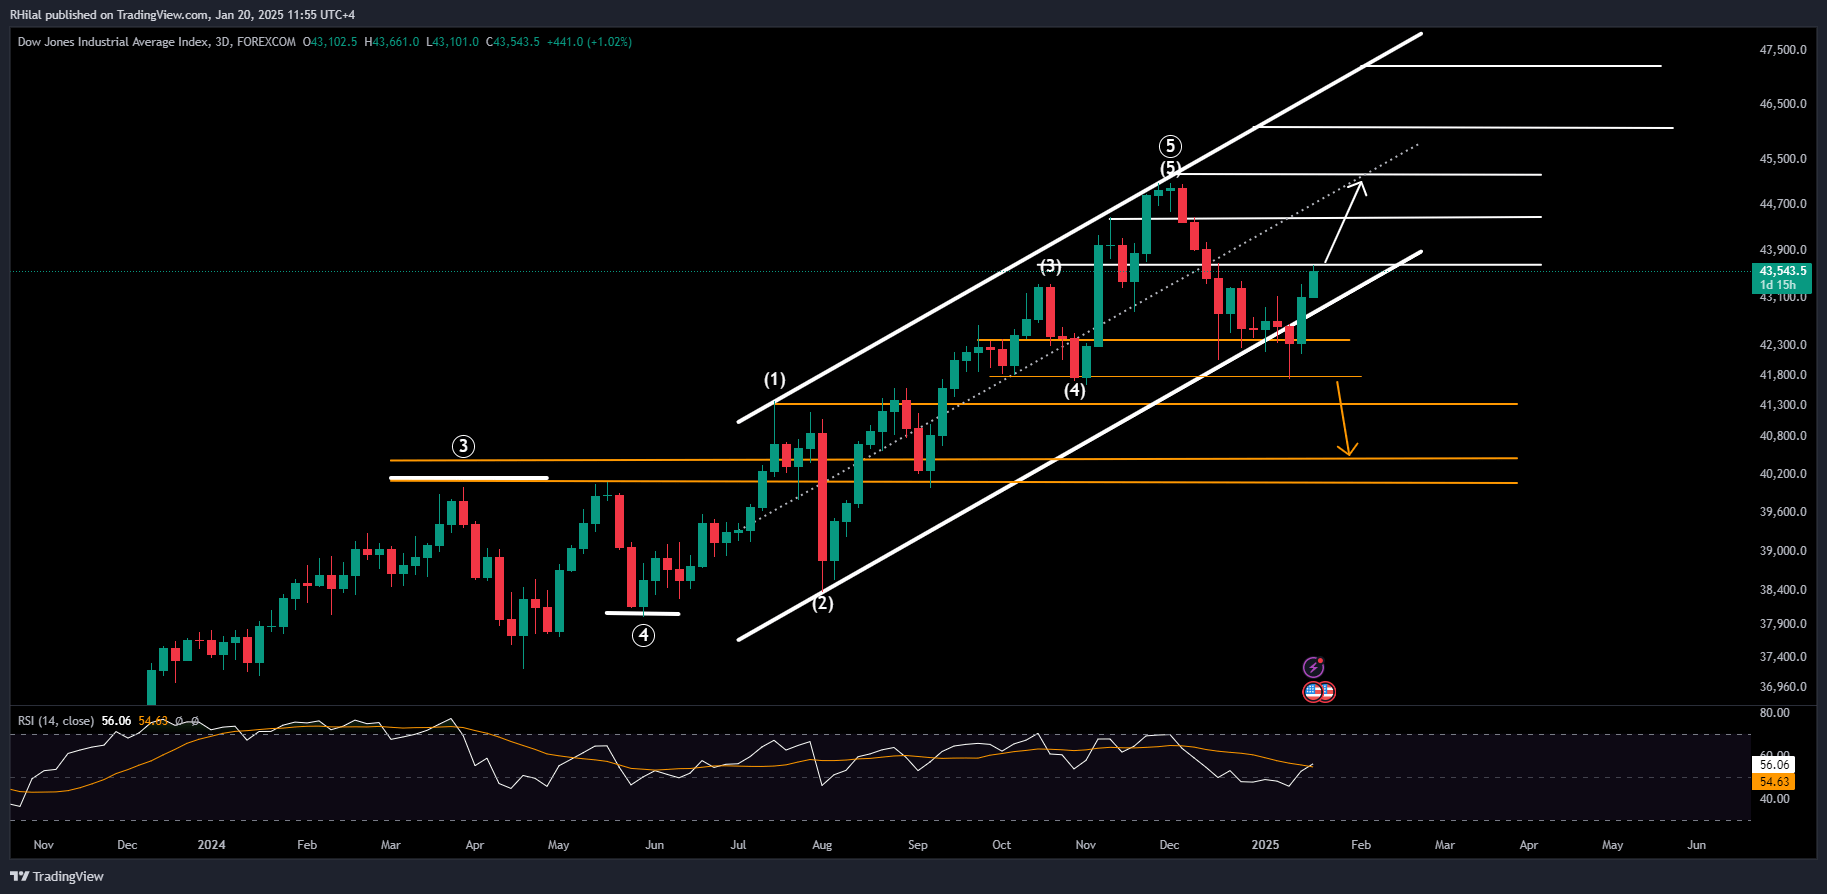
The Dow Jones Industrial Average (DJIA) has rebounded into its up trending parallel channel, established between May and December 2024. The latest dip outside the channel retested the November 2024 low at 41,739 before climbing back above the 43,000-barrier.
Key Resistance Levels:
• 43,700, 44,500, and 45,200.
• A firm break above 45,200 could extend gains toward new highs at 46,000 and 47,200.
Key Support Levels:
• If the Dow reverses back outside the channel, below the 42,400 and 41,800 support zones, coupled with an RSI break below the neutral zone (respected since April 2024), declines could target critical support levels at 41,400, 40,400, and 40,000.
Technical Analysis (TA) Tip: Market Noise and Shadows
Market noise (volatile trends) and shadow wicks on candlestick charts can disguise trends. Longer time frames, such as daily and weekly charts, help reduce noise and provide a clearer perspective on price direction and key levels, making it easier to distinguish meaningful trends from short-term volatility. The Dow’s primary uptrend was breached with an extended wick towards the 41,700 zone, and reversed back inside its primary uptrend, reinforcing bullish bias on the chart.
Written by Razan Hilal, CMT
Follow on X: @Rh_waves
YouTube: Forex.com