Weekly Technical Trade Levels on USD Majors, Commodities & Stocks
- Technical setups we are tracking into the weekly open- US CPI on tap
- Next Weekly Strategy Webinar: Monday, January 27 at 8:30am EST
- Review the latest Video Updates or Stream Live on my YouTube playlist.
In this webinar we take an in-depth look at the technical trade levels for the US Dollar (DXY), Euro (EUR/USD), British Pound (GBP/USD), Australian Dollar (AUD/USD), Canadian Dollar (USD/CAD), Japanese Yen (USD/JPY), Swiss Franc (USD/CHF), Gold (XAU/USD), Silver (XAG/USD), Crude Oil (WTI), Bitcoin (BTC/USD), S&P 500 (SPX500), Nasdaq (NDX), and the Dow Jones (DJI). These are the levels that matter on the technical charts into the weekly open.
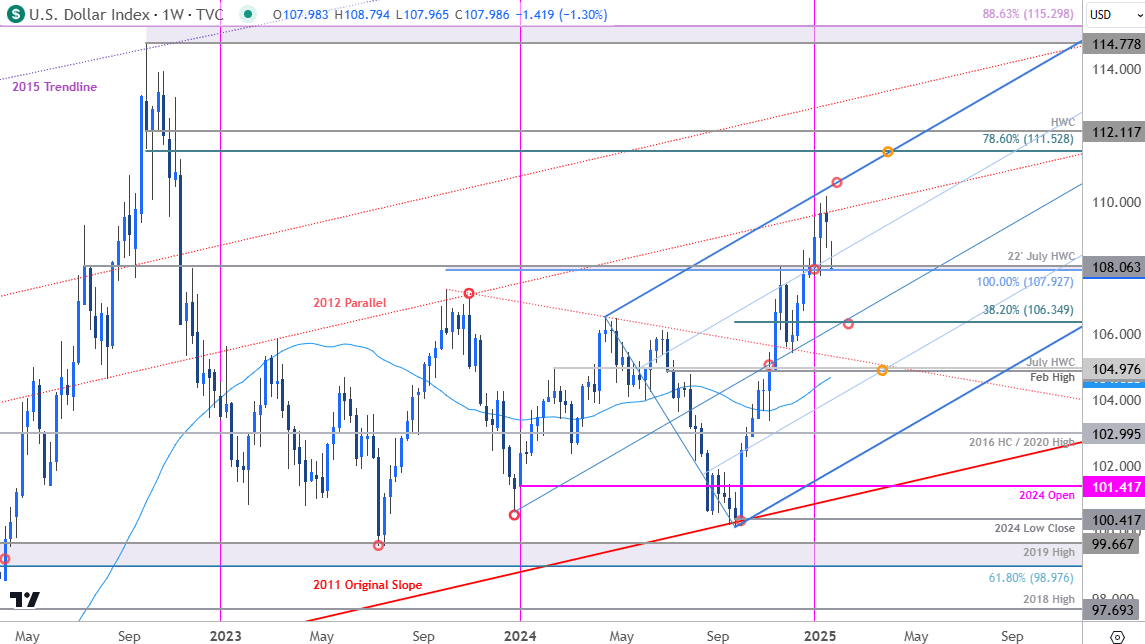
US Dollar Price Chart – USD Weekly (DXY)

The US Dollar Index may be vulnerable on the heels of President Trump’s Inauguration with DXY faltering at long-term uptrend resistance last week. The reversal snaps a six-week winning streak with DXY trading into support today at 107.93-108.06- watch the weekly close with respect to this threshold with a close below needed to suggest a larger correction is underway towards 106.35. Broader bullish invalidation now raised to 105.
Weekly resistance is eyed with the objective high-week close at 109.40 and is backed again by the upper parallel. A topside breach above this slope is needed to fuel the next major leg of the advance towards the 78.6% retracement / 2022 high-week close (HWC) at 111.52 & 112.11 respectively.
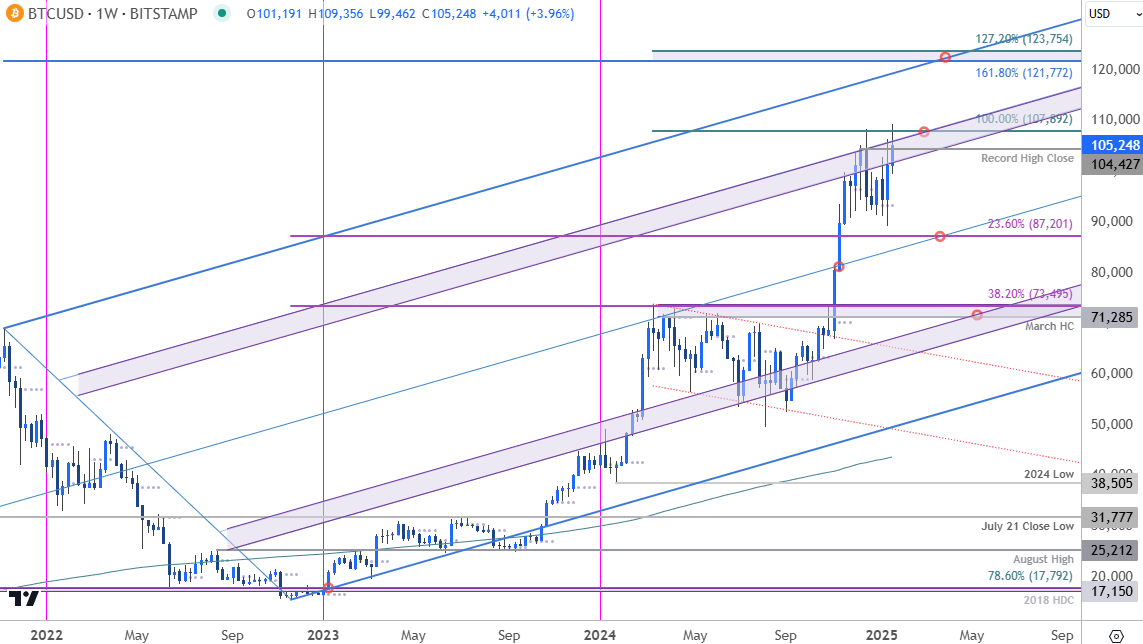
Bitcoin Price Chart – BTC/USD Weekly

Chart Prepared by Michael Boutros, Sr. Technical Strategist; Bitcoin on TradingView
Bitcoin registered a fresh record intraday high with BTC/USD attempting to break major technical resistance ahead of the President Trump’s Inauguration yesterday. The immediate focus is on the weekly close with respect to 107,892 with a breach / close above needed to mark uptrend resumption towards confluent resistance at 121,772-123,754.
Monthly / yearly open support rests at 93,347 and is backed by the 23.6% retracement of the late-2022 advance at 87,201. Broader bullish invalidation now raised to the March high-close / 38.2% retracement at 71,285-73,495.
Bottom line: Bitcoin is testing technical resistance for the second time in two-months. From a trading standpoint, losses should be limited to the monthly open IF price is heading higher on this stretch with a weekly close above 107,982 needed to fuel the next major leg of the advance.

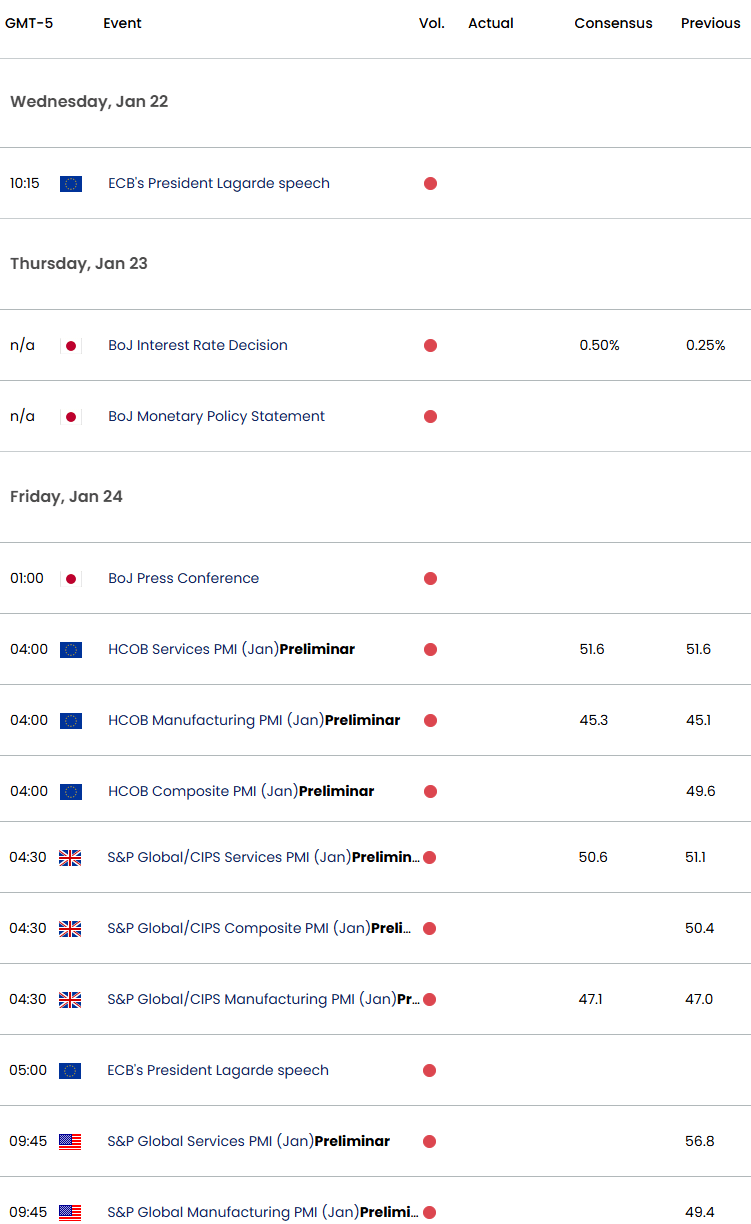
Economic Calendar – Key USD Data Releases

Economic Calendar - latest economic developments and upcoming event risk.
--- Written by Michael Boutros, Sr Technical Strategist
Follow Michael on X @MBForex