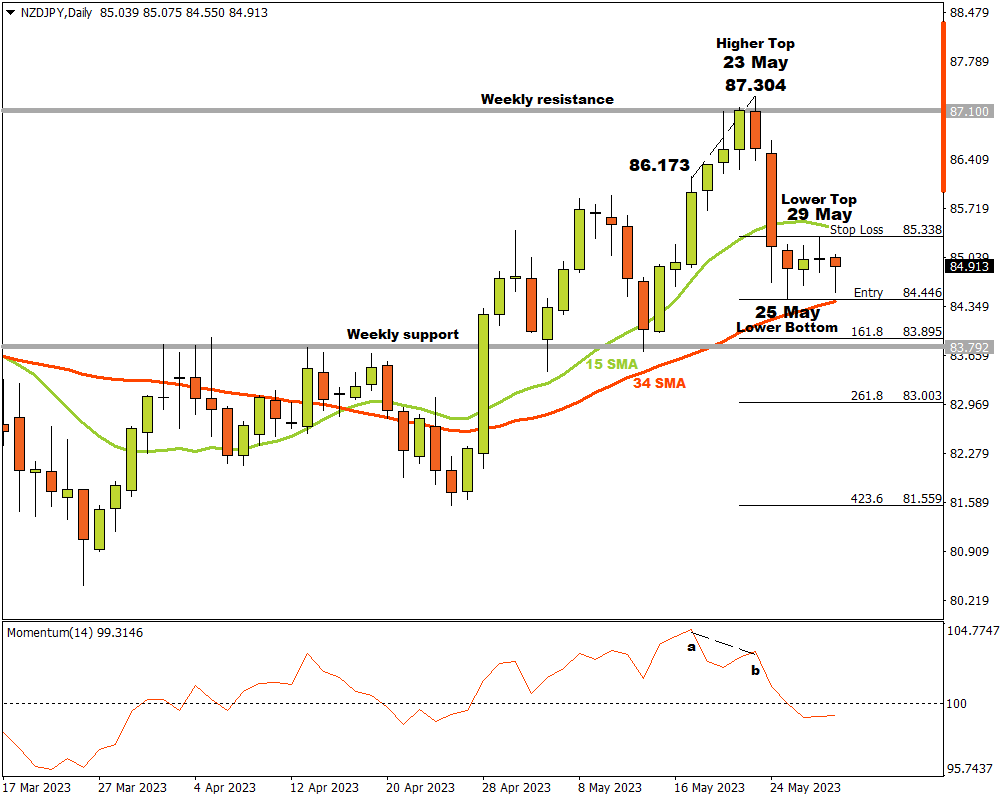
The NZDJPY bulls on the D1 time frame have been making higher tops and bottoms since the beginning of May.
A last higher top was reached when the price bounced off a weekly resistance level on 23 May at 87.304.
A closer look at the Momentum Oscillator reveals negative divergence between point “a” and “b” when comparing the tops at 86.173 and 87.304.
This could have alerted technical traders that the bears might be stirring and getting ready to challenge the bullish reign.
Confirmation of this was in the form of strong bearish candles with the market breaking through the 15 Simple Moving Average and the Momentum Oscillator dipping into bearish territory.
A possible critical support level formed near the 34 Simple Moving Average when a lower bottom was recorded on 25 May at 84.446.
The bulls then tried to regain the upper hand, but a lower top formed on 29 May at 85.338.
If the bears break through the critical support level at 84.446, then three possible price targets can be set from there.
Attaching the Fibonacci tool to the lower bottom 84.446 and dragging it to the resistance level at 85.338, the following targets can be determined:
-
83.895 (161.8%)
-
83.003 (261.8%)
- 81.559 (423.6%)
If the resistance level at 85.338 is challenged and broken, the current scenario is not valid any longer.
As long as support overcomes demand and market sentiment stays negative, the outlook for the NZDJPY on the D1 time frame will remain bearish.
