The global stock market is on track to post the best month as the Dow Jones Industrial Average not only crossed the 30K level for the first time, but the stock index also closed above those levels as well. The entire move is very much led by the optimism that there will be a smooth transition of power by Donald Trump to Joe Biden, and the forthcoming coronavirus vaccine. Traders are also optimistic about Biden’s selection of his team especially, Janet Yellen, as the US Treasury Secretary.
The Asian stock market recorded gains and closed mostly in positive territory. The ASX 200 index closed with a gain of 0.59%. The Korean Kospi index declined 0.62%, while the Nikkei index advanced 0.50%. The Shanghai index fell by 1.19%.
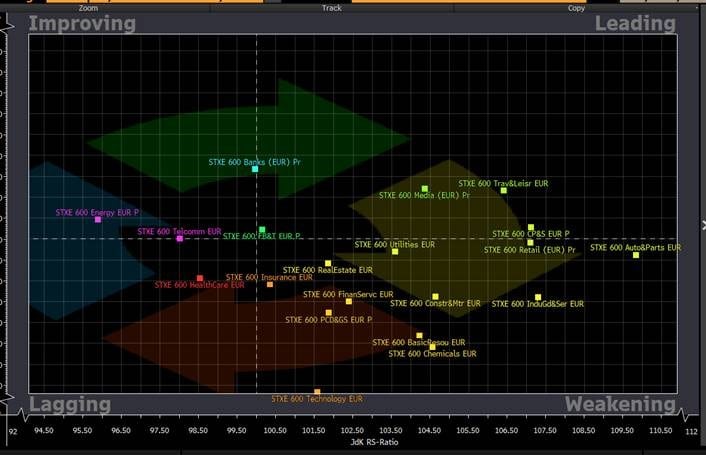
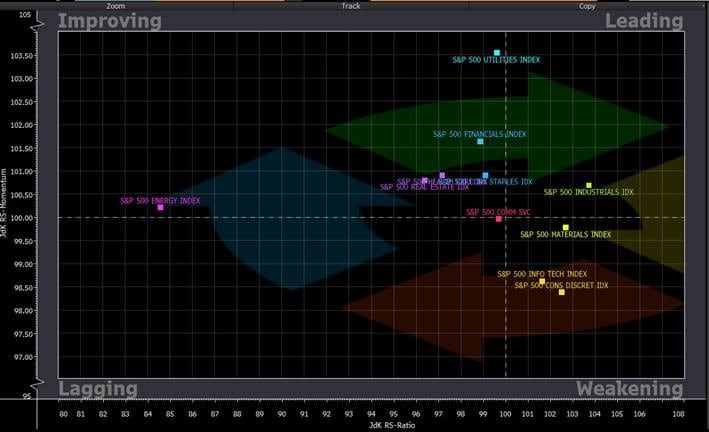
Sector Rotation
The below chart shows stronger and weaker sectors

The below chart shows stronger and weaker sectors

Dow Jones and S&P 500: Market Breadth
The Dow Jones’ market breadth gained enormous strength yesterday. 87% of the Dow Jones stocks traded above their 200-day moving average. This is a change of +7% from a day earlier.
The S&P 500 stock breadth also become stronger. 90% of the shares traded above their 200-day moving average. This is a change of +2% from a day earlier.
Dow Jones Futures Today
The Dow Jones futures are trading lower by 25 points today. In terms of economic data, investors will be looking at the Revised UoM Consumer Sentiment data. The forecast for the data is 76.9, while the previous reading was at 77.
The Dow Jones futures moved into uncharted territory yesterday and recorded another all-time high, which we have previously discussed.
The Dow’s futures are trading well away from their 50-day simple moving average on the 4-hour time frame, which means that a retracement is well due.
Looking at the 4-hour time frame, it is likely that the Dow may retrace all the way to 29775, and a break of that level can open the door for further correction, which means that we can see the Dow Jones price moving near 29,585.
As for the strength, the bulls are certainly in full control of the price as the price is trading near the 50, 100, and 200-day SMA on the daily time frame.
The S&P 500 futures, which represent the wider stock market, have not reached their all-time high yet. There is no doubt that the S&P 500 index is the lagging index when compared with the Dow Jones index.
This also raises some concerns as the S&P 500 is a better representation of the US stock, as mentioned above. In terms of price action, the bulls are still ruling because the current price of the S&P 500 is well above the 50, 100, and 200-day simple moving averages on the daily time frame. The resistance level is at an all-time high, which is at 3,667, and the support is at 3,548.
Stock Market Rally
The S&P 500 stock index recorded more gains yesterday; the index advanced 1.62%. The financial sector led the index lower- 9 out of 11 sectors closed higher.
The Dow index closed at a record high yesterday; the Dow stocks moved the index higher by 1.54%. Twenty-six shares advanced while three shares closed lower.
The NASDAQ composite, a tech-savvy index, closed higher by 1.46% yesterday.
S&P 500 Leaders and Laggards: Dollar Tree and Best Buy
Dollar Tree stock contributed the biggest gain, soaring 14.1%. Best Buy was the largest drag; it fell by 6.96%. The S&P 500 stock index is up 11% so far this year.
Dow Jones Leaders and Laggards: Goldman Sachs and Amgen
Goldman Sachs provided the biggest help for the Dow Jones; it advanced by 3.79%, while Amgen was the largest decliner, it fell by 0.79%.
Bitcoin
The crypto king Bitcoin made another high for this year, but it has broken above its all-time high. XRP has also started to rally, and it also touched the highest level for the year and made a high of 0.78 yesterday.