-
Fed to release bank stress test results after US markets close today
-
2023’s test comes after several US banks, including SVB, collapsed in March
- WSt30_m index may be dragged lower on weaknesses uncovered/tighter capital rules for US banks
Investors and traders in US banking stocks are awaiting key news that could rock share prices over the coming days.
The Federal Reserve (US central bank) will unveil the results of its latest annual bank stress test later today.
What is this stress test?
The Fed has conducted this yearly test publicly since 2009, following the Global Financial Crisis – the worst since the Great Depression (1929-1941).
The aim is to find out if the US banking system can withstand hypothetical economic crises.
23 banks will undergo 2023’s stress test, fewer than the 34 banks tested in 2022.
Why is this important?
This stress test is an important part of the Fed’s key objective in promoting “a safe, sound and efficient banking system”.
This year’s test results also bear greater significance in light of the US banking crisis (three US banks collapsed, including Silicon Valley bank) in March 2023.
The bank failures earlier this year occurred despite all the tests in years past.
Hence, markets may be more sensitive to the latest stress test results, with the Fed also set to be more stringent in ensuring that US banks are more resilient following this year’s banking turmoil.
What’s being tested this year specifically?
The Fed’s stress test will want to check how well US banks will hold up under a hypothetical “severe recession” scenario, including:
-
US jobless rates peaking at 10% (latest data: US unemployment rate at 3.7% in May 2023).
-
US house prices plummeting by 38%/commercial properties see 40% drop
-
Recessions in the euro area, UK, developing Asia, and Japan
- US dollar soars against all currencies, except for the Japanese Yen
And for the first time ever ...
The Fed has added a “global market shock component”, aimed at testing global systemically important banks (G-SIBs) against more intense inflation and further rate hikes.
These G-SIBs include Wall Street giants such as Goldman Sachs and JPMorgan Chase.
When will the Fed release the results?
The Fed is set to announce the results of its latest stress test at 20:30hrs GMT on Wednesday, June 28th.
Then, two days later (perhaps Friday afternoon), the Fed is expected to unveil what each bank must specifically do/change in terms of its capital (how much money it has to set side to weather economic turbulence).
How are US banks expected to perform?
Overall, the big banks are expected to pass the Fed’s test.
However, markets are bracing for the Fed still requiring additional capital buffers out of some of the biggest US banks.
Note that, just last week, Fed Chair Jerome Powell told the US senate Banking Committee that the largest US banks may have to set aside 20% more capital as precaution.
That could mean less money that can be used for share buybacks or dividend payouts.
Investors in banking stocks are not going to like the sound of that.
What does all this mean for WSt30_m index?
Our WSt30_m index mirrors the benchmark Dow Jones index, which feature 30 industry leaders in the US economy.
Among that list of 30 include: Goldman Sachs and JPMorgan Chase, which together account for about 8.8% of the WSt30_m index.
In other words, how Goldman Sachs/JPM share prices react to the Fed’s stress test results is set to have large influence over the WSt30_m index.
NOTE: US banking stocks account for just under 3% of the S&P 500, which is tracked by the SPX500_m index.
Unless the bank stress test results permeate across stock markets, the SPX500_m is set to see a smaller impact from the stress test, rather than the WSt30-M.
Potential Scenarios:
-
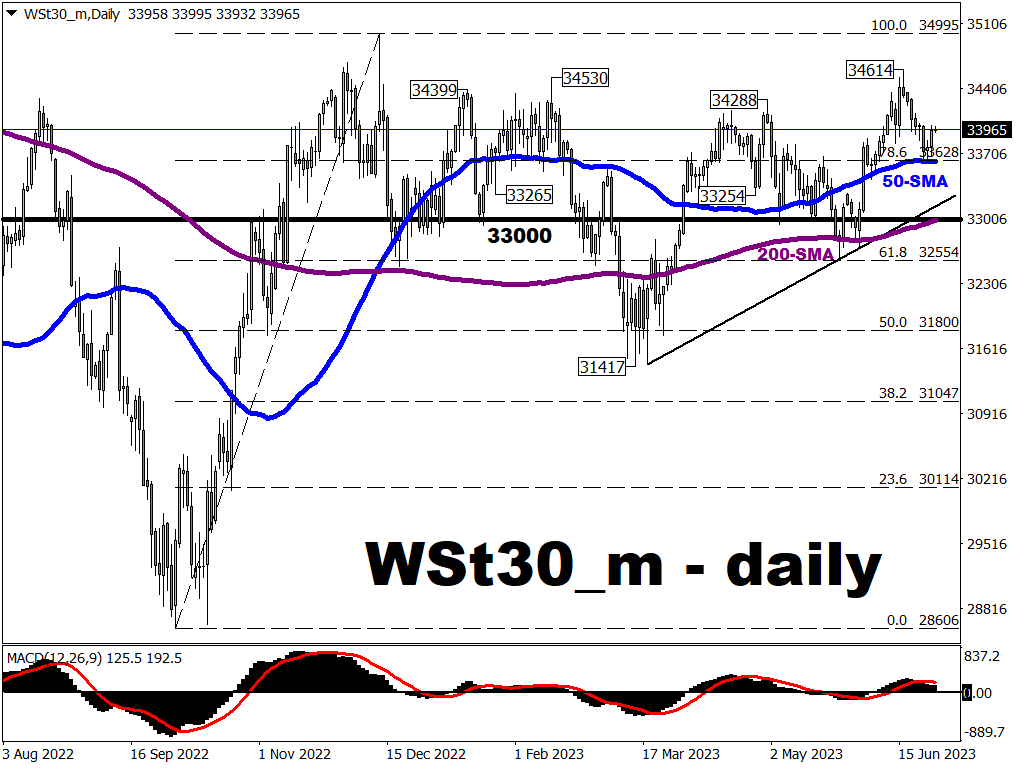
WSt30_m index could be dragged lower if the stress test reveals bigger cracks in the banking system/requires larger capital buffers.
- WSt30_m index may see some gains if the stress test proves that the March US banking crisis episode was an anomaly, with risks now mitigated and the US banking sector now in a healthy and robust state to weather any further economic/financial turbulence.
However, noting that recession fears still abound across global stock markets, immediate upside for the WSt30_m may prove limited and temporary.
Key levels:
POTENTIAL SUPPORT:
-
50-day simple moving average (SMA) (same area as the 78.6% Fibonacci level from WSt30_m’s October-December 2022 ascent.
-
33,254 – 33,265 region
- 33,200: upward lower trendline since March
POTENTIAL RESISTANCE:
-
34,288: May 2023 cycle high
-
34,399 – 34,530: Jan – Feb cycle highs
- 34,614: latest cycle high
