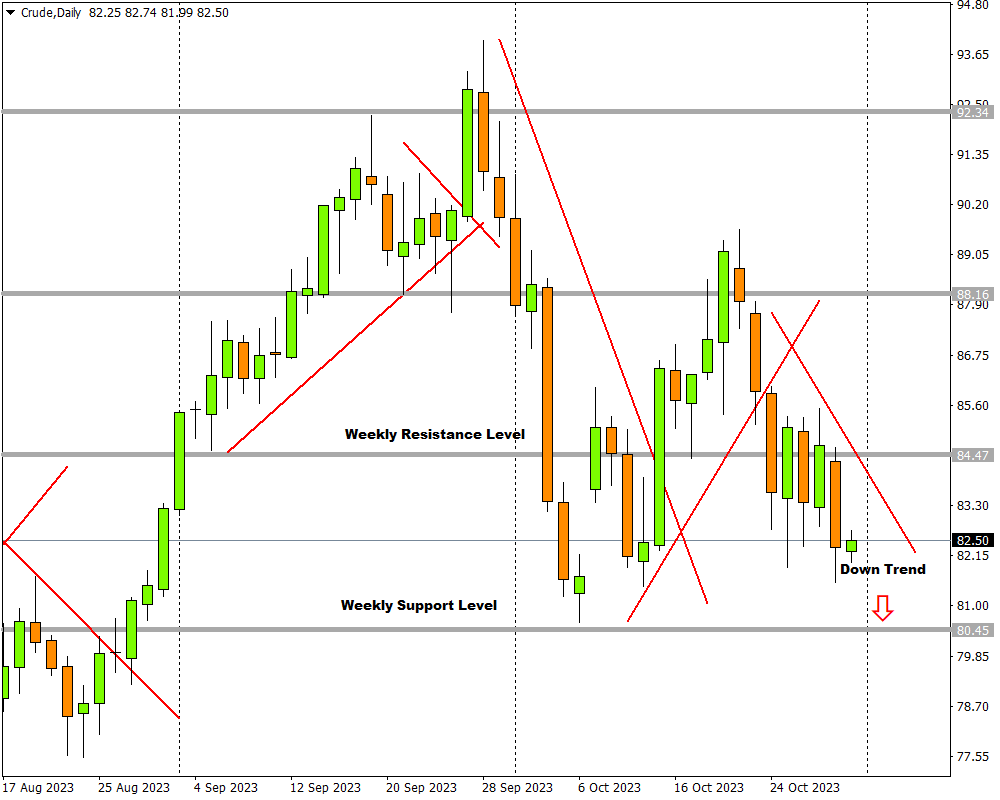
- Crude oil under pressure on D1 timeframe
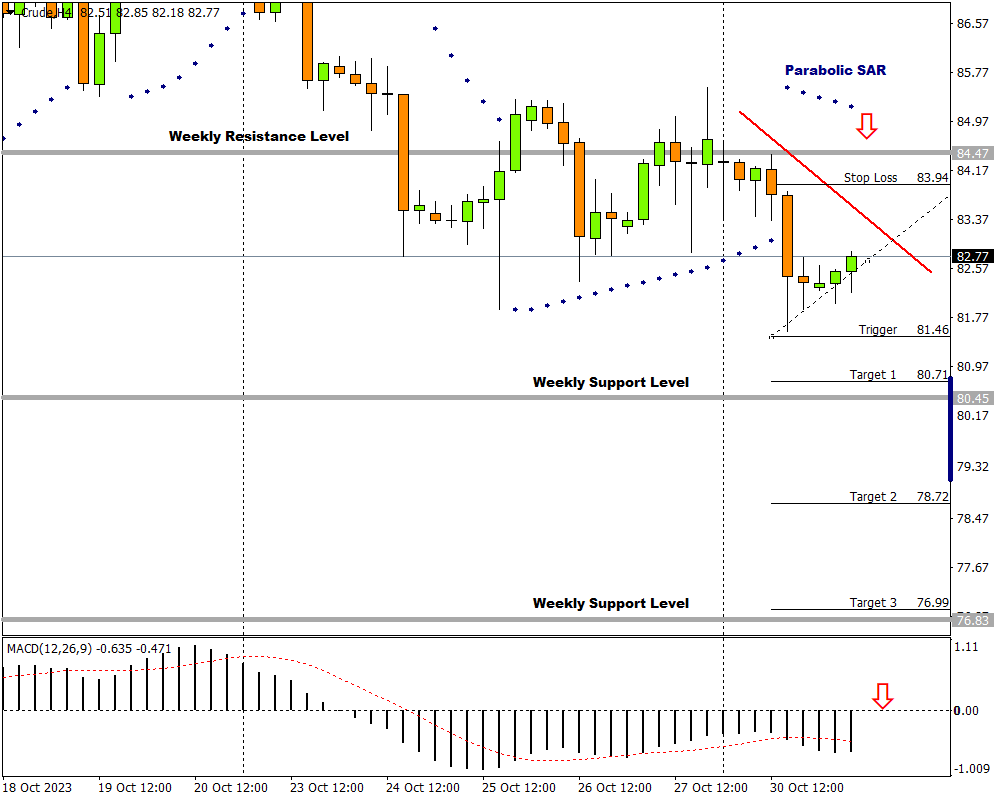
- H4 timeframe confirms that bears are in control
- Keep eye on Parabolic SAR and MACD
- Three potential bearish targets identified on H4 chart
- If the 83.94 level broken, H4 bearish scenario invalidated
Oil prices remain dominated by bears on the daily timeframe as the global commodity creates a lower top followed by a lower bottom.
This represents a downtrend that could send prices toward the weekly support level of 80.45. However, bulls have the potential to jump back into the scene by starting a correction wave with their goal none other than the weekly resistance level at 84.47.

The H4 chart confirms that the bears are in charge with a downtrend in progress. Bulls started a correction wave in the downtrend with both the Parabolic SAR indicator and the Moving Average Convergence Divergence (MACD) oscillator sanctioning this direction.
Attaching a modified Fibonacci tool to a trigger level near the last lower bottom at 81.46 and dragging it close to the top of a large bearish candle at 83.94, three possible targets can be established:
-
The first possible target is at 80.71 (Target 1), just before a weekly support level. This target will help with risk management.
-
The second price target is likely at 78.72 (Target 2) if the bears can break through the weekly support level.
-
The third and last price target is feasible at 76.99 (Target 3).
If the price at 83.94 is broken, this scenario is no longer relevant.
