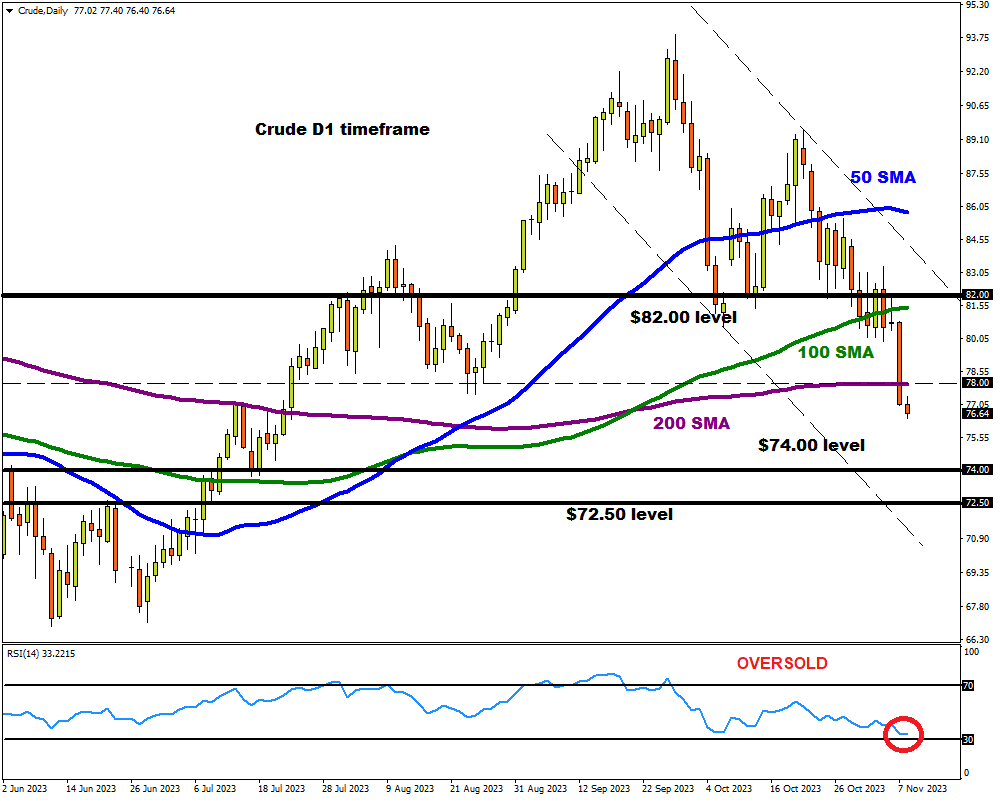
- Crude dives over 4% in previous session
- Prices secure daily close below 200-day SMA
- Monthly and weekly timeframe signal further downside
- Bears in control on D1 charts but RSI near oversold territory
- Key levels of interest at $82, $78 and $74
Oil struggled on Wednesday after sliding more than 4% in the previous session to levels not seen since July.
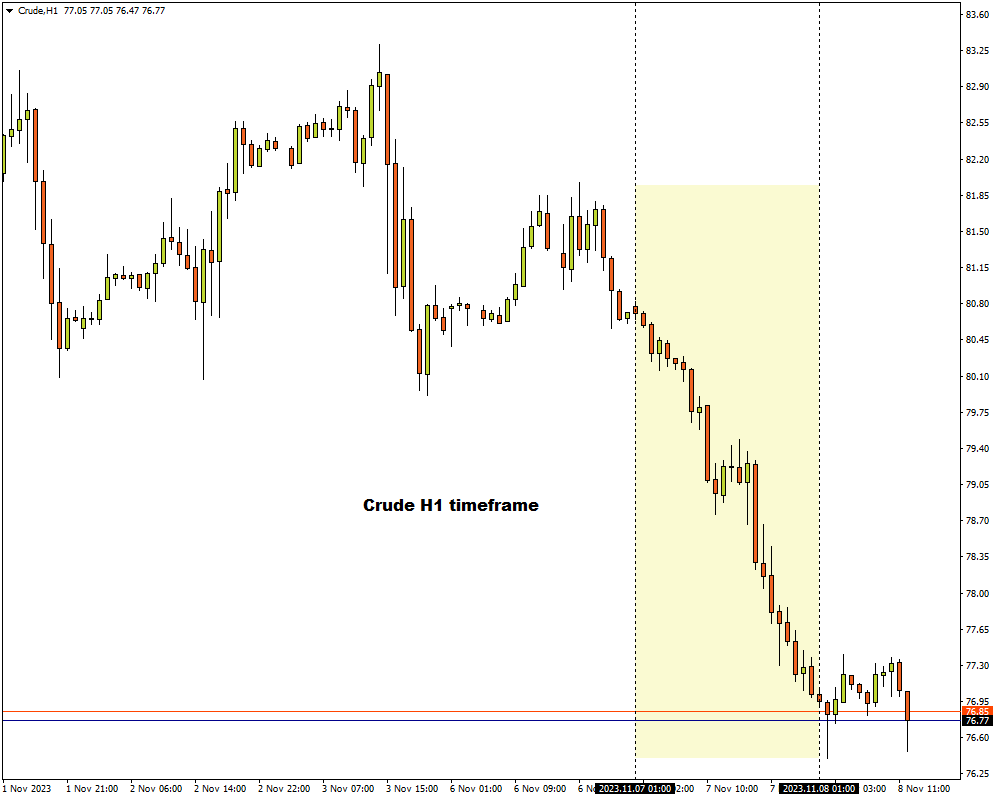
The global commodity was hammered by demand concerns which provided a platform for bears to drag prices below the 200-day Simple Moving Average (SMA) for the first time in over three months.
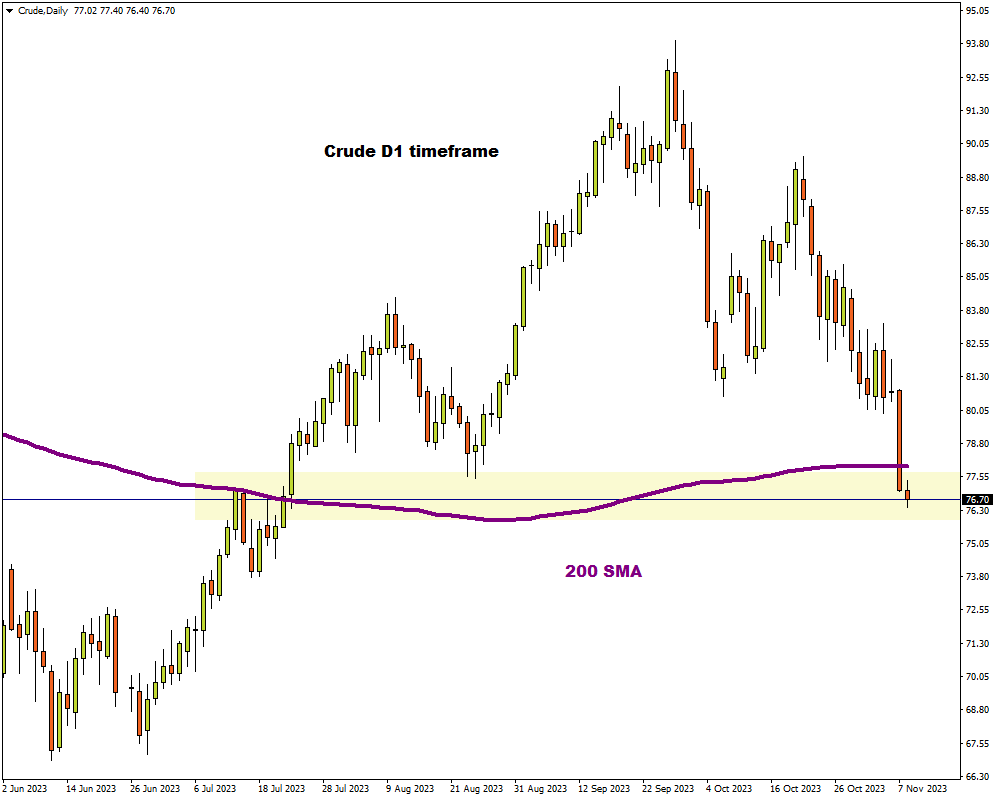
It is worth noting that technical indicators were already in favour of bears before yesterday’s steep selloff. Oil was already respecting a negative channel on the daily charts, creating lower lows and lower highs. The daily close below the 200-day SMA may open doors to lower price levels in the short to medium term.
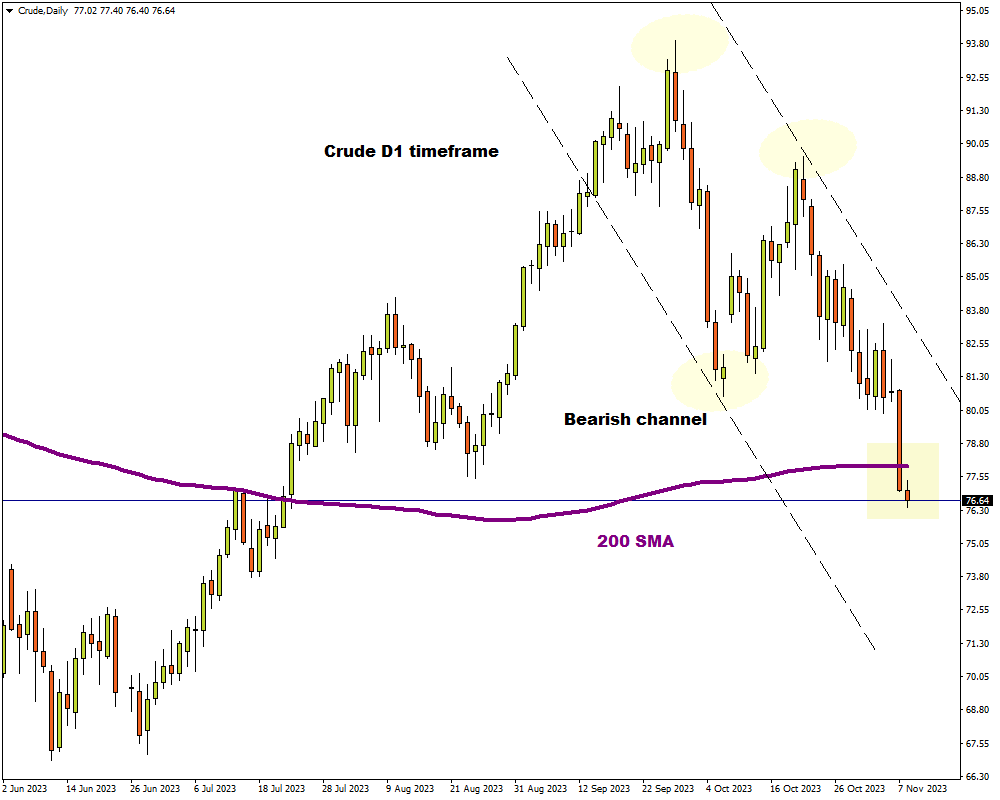
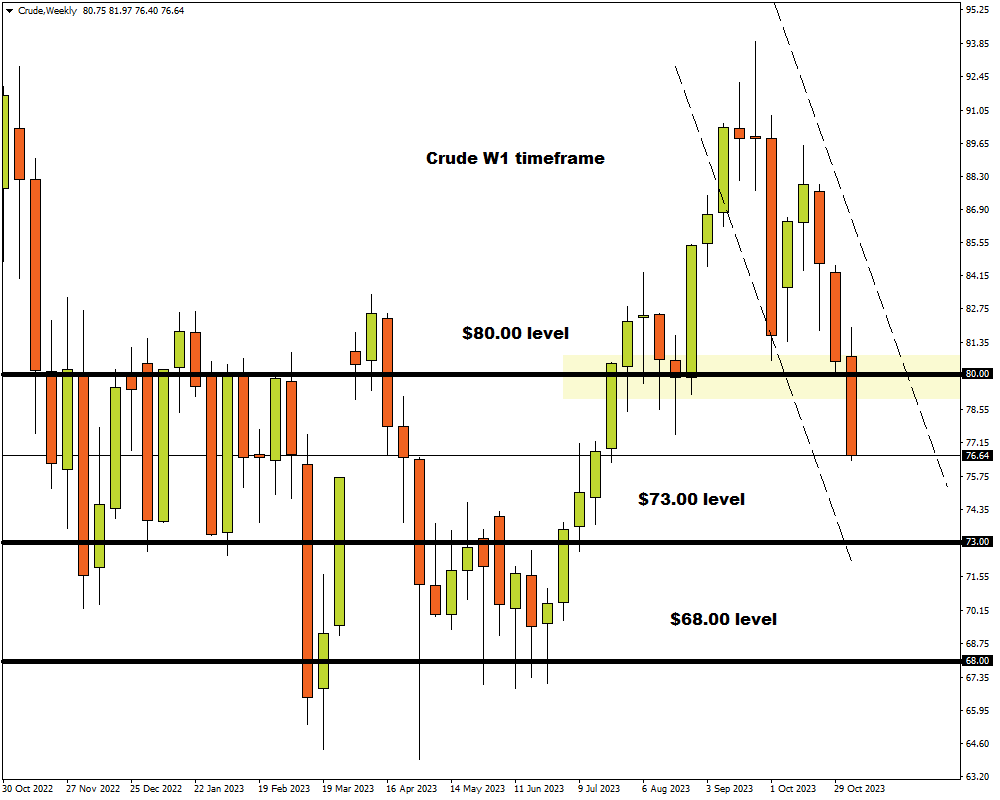
Zooming out to the weekly charts, we see a similar bearish picture with crude on the path to securing its third negative trading week. Prices have broken through the $80 weekly support with the next key level of interest on the W1 timeframe around $73 and $68.
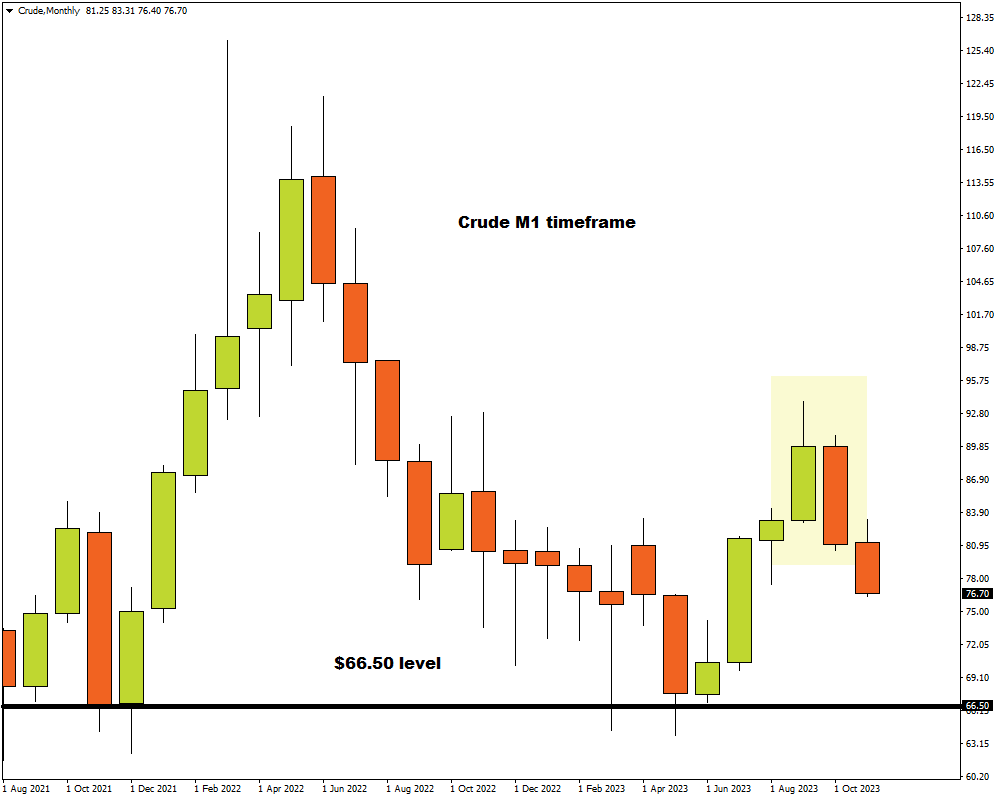
Peeking at the monthly charts, the bearish candlestick created in October further supports the bearish case, signaling the possibility of lower prices to come with key monthly support found at $66.50.
Redirecting our attention back to the daily timeframe, bears are certainly in control and may use the current momentum to drag crude toward the next daily support at $74. However, the Relative Strength Index (RSI) is flirting near 30, indicating that crude may be oversold. While this could trigger a technical rebound down the road, the path of least resistance remains south.
-
Sustained weakness below the 200-day SMA may send prices towards $74 and $72.50.
-
Should prices push back above the 200-day SMA, this could spark a move back towards $82
