- Bitcoin bullish on D1 timeframe
- W1 support could provide long opportunity
- Prices above 50 LWMA on H4 timeframe
- 4 potential bullish targets if 43865.08 breached
- Bullish scenario invalidated below 41597.80
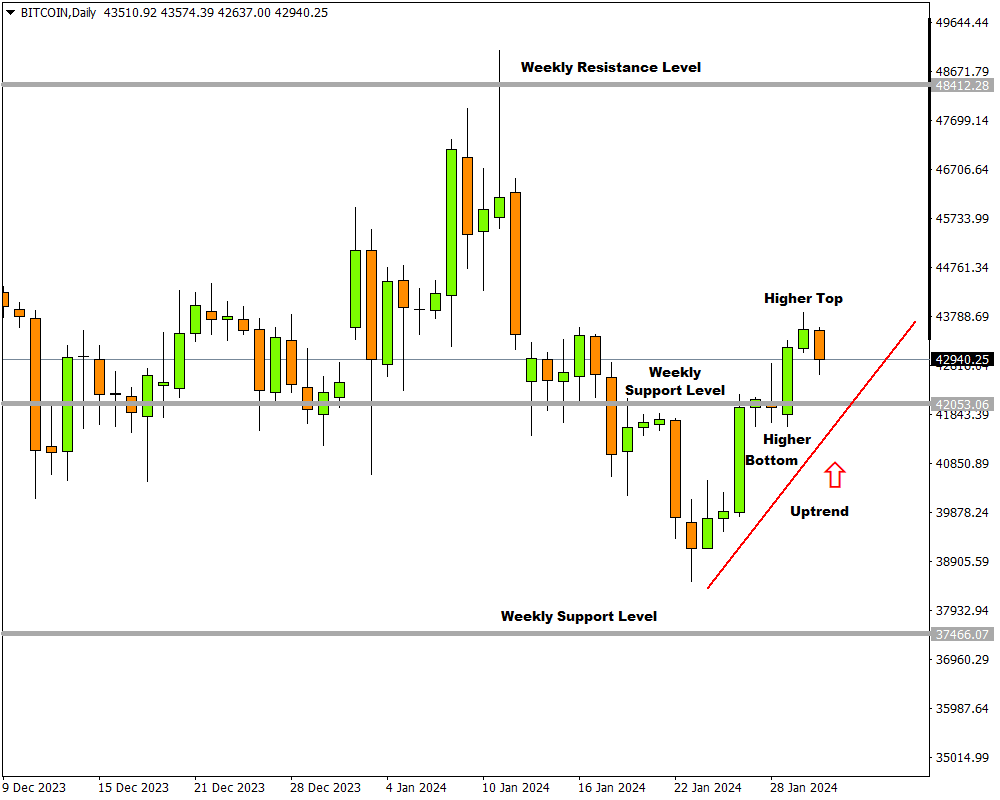
Bitcoin kicked of the week charging through a significant resistance level at 42053.06, signalling the start of a potential uptrend on the daily timeframe.
This was confirmed by the most recent higher bottom and higher top created in yesterday’s trading session. Despite the bullish outlook, bears are currently busy with a correction wave and will be aiming at the weekly resistance turned support to test the bullish resolve.
Nevertheless, this sets up possible long opportunities on lower time frames if the bulls can regain their momentum and keep on dominating the market.

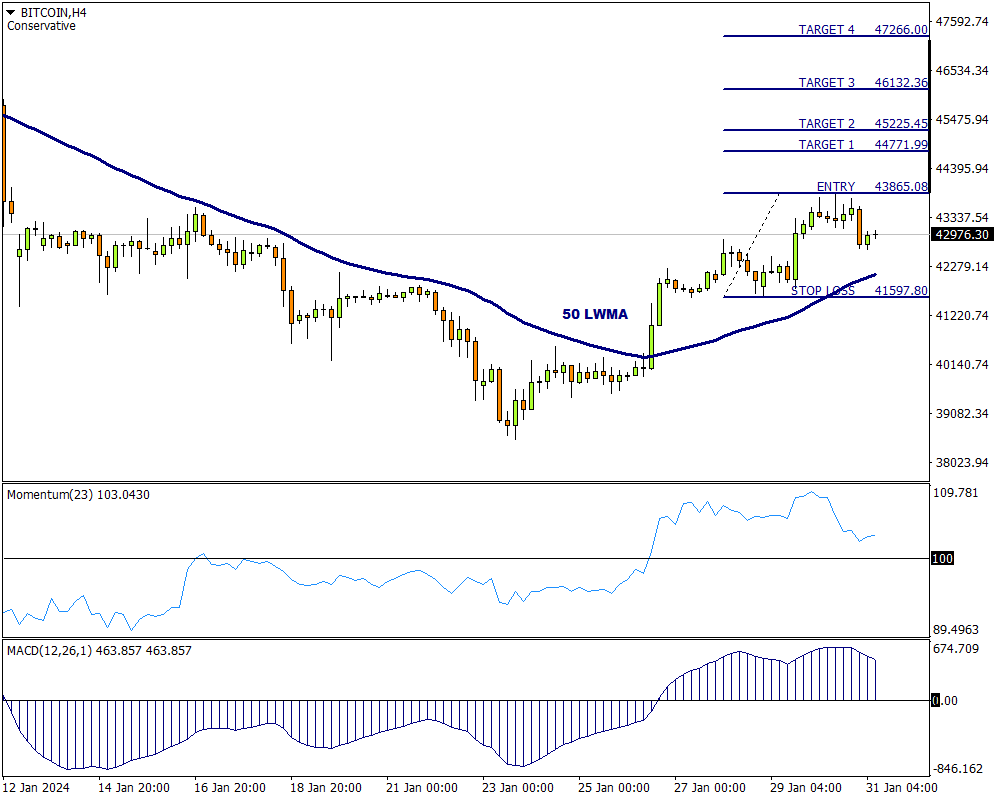
On the 4-hour chart a beautiful uptrend is in progress with consecutively higher tops and bottom in place. The price is also above the 50 Linear Weighted Moving Average with the Momentum and the Moving Average Convergence Divergence (MACD) oscillators in clear bullish terrain.
If the price reaches the 43865.08 level, yet another higher top will be in process, and this presents a long opportunity.
Attaching a modified Fibonacci tool to the trigger level at 43865.08 and dragging it to the last higher bottom at 41597.80, four possible conservative targets can be determined:
-
Target 1: 44771.99
-
Target 2: 45225.45
-
Target 3: 46132.36
-
Target 4: 47266.00

If the price breaks past the 41597.80 level, this opportunity is no longer feasible, and a short opportunity might become possible from a 4-hour market structure point of view.