- UK100 trapped within range
- UK Spring budget could impact index
- Prices above 50, 100 and 200-day SMA
- Double bottom on D1 chart
- Key weekly resistance at 7689.2
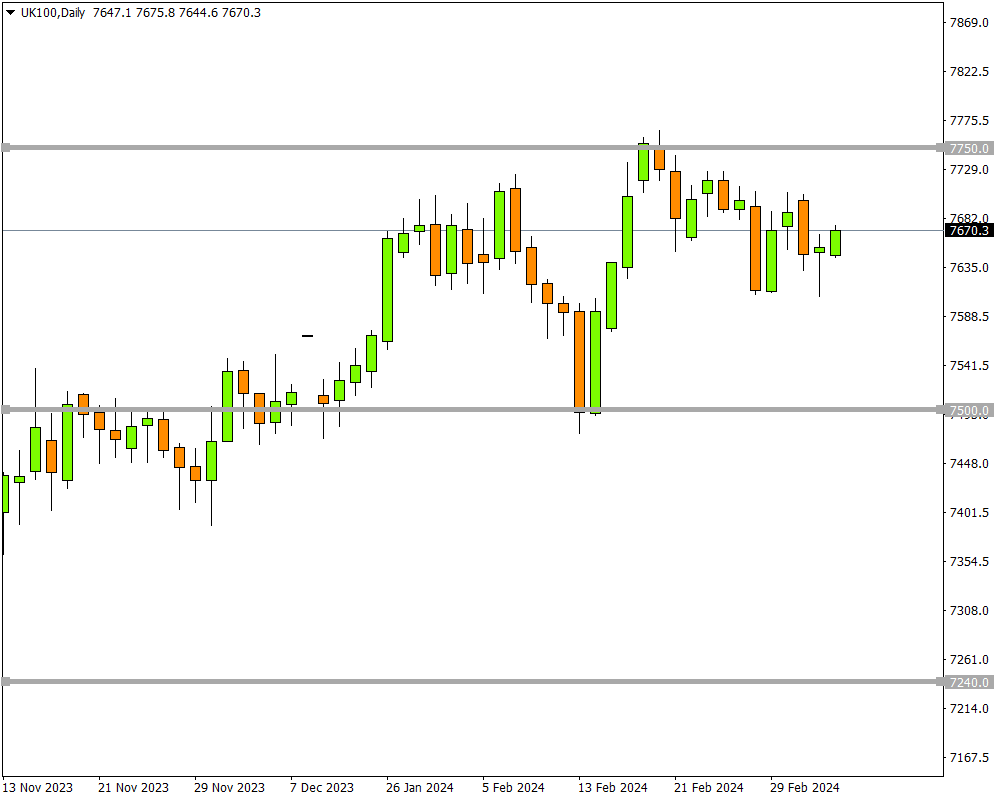
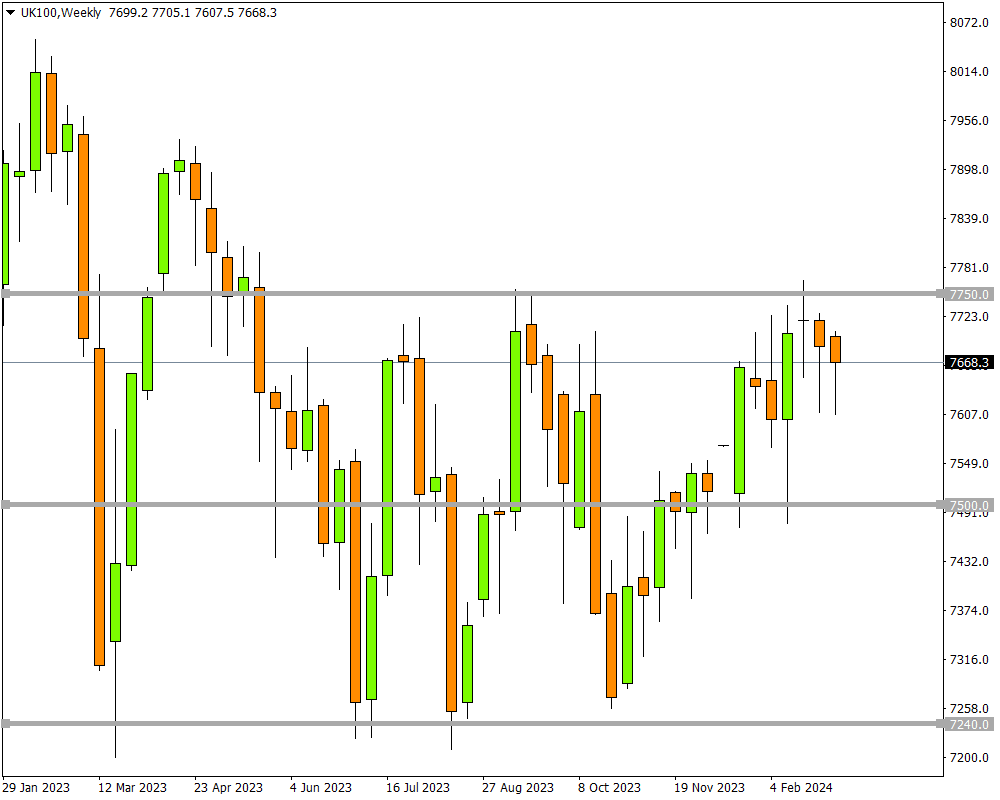
After swinging within a range on the weekly charts, the UK100 which tracks the underlying FTSE100 index could be gearing up for a significant move.

Over the past few months, the index has been influenced by various fundamental forces ranging from the pound’s value to corporate earnings and monetary policy expectations.

Note: The FTSE100 has a strong international focus with 75% of revenues from FTSE100 companies coming from outside the UK.
Looking at the recent price action, a breakout could be on the horizon. This may be triggered by the UK Spring Budget this afternoon, presented by Chancellor of the Exchequer Jeremy Hunt.
- The budget could provide fresh insight into the country’s economic outlook, finances, public spending, and government’s plan for tax.
- Given how a UK general election is fast approaching, there is growing speculation around Hunt presenting tax cuts to shift the polls in favour of his own party.
- Such a development may fuel inflation, which remained unchanged at 4% in January.
- Ultimately, complicating the Bank of England’s ability to cut interest rates as much as markets expect.
Note: Traders are currently pricing in a 42% probability of a 25-basis point BoE cut by June, with a cut by August fully priced in.
How will this impact the UK100?
When the pound appreciates, it results to lower revenues for FTSE100 companies that acquire sales from overseas, pulling the UK100 lower as a result. The same is true vice versa.
So essentially,
- The UK100 could see fresh downside pressure if the spring budget confirms tax cuts and strengthens the pound as investors push back BoE cut bets.
- Should the spring budget omit anything about tax cuts and the pound weakens, this may push the UK100 higher.
Regarding the technical picture…
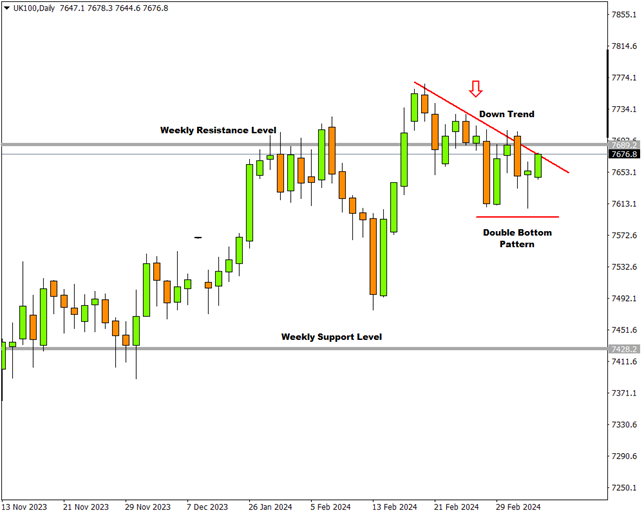
The FTSE 100 Index (UK100) on the daily time frame made a double bottom and this might signal the end of the current down trend. There is a strong weekly resistance level that will need to be broken though, and this remains to be seen.

On the 4-hour chart an uptrend is in progress with the above-mentioned weekly resistance level at 7689.2 lying right in ahead. Based on projected normal ebb and flow price structures, that means there are two scenarios.
- Number 1 is that the price bounces off the resistance level and after a possible with a retest, a short opportunity might ensue.
- Number 2 is that the price breaks through the resistance level, retests the resistance turned support level and then continues upward. In this case a long opportunity.
Both the 50 Exponential Moving Average and the Moving Average Convergence Divergence (MACD) Oscillators confirm that the above-stated scenarios are a possibility.
