Global equity markets flashed red on Thursday as rate hike fears soured the market mood and left investors on edge.
European shares fell this morning thanks to hot Eurozone inflation figures while US futures pointed to further losses amid concerns over more rate hikes. In the currency space, the dollar rebounded – drawing strength from rising Treasury yields. It was a choppy affair for gold, but prices seem to be recovering with $1825 acting as a key level of interest.
Over the past weeks, the markets have displayed sensitivity to Fed chatter, inflation data, and rate hike expectations. Given how Fed Chair Jerome Powell will be under the spotlight next week and the NFP report will be published on Friday 10th March, volatility could be around the corner. In the meantime, the next few days could be the calm before the potential market storm.
Our focus this afternoon will fall on various assets with the tool of choice none other than technical analysis.
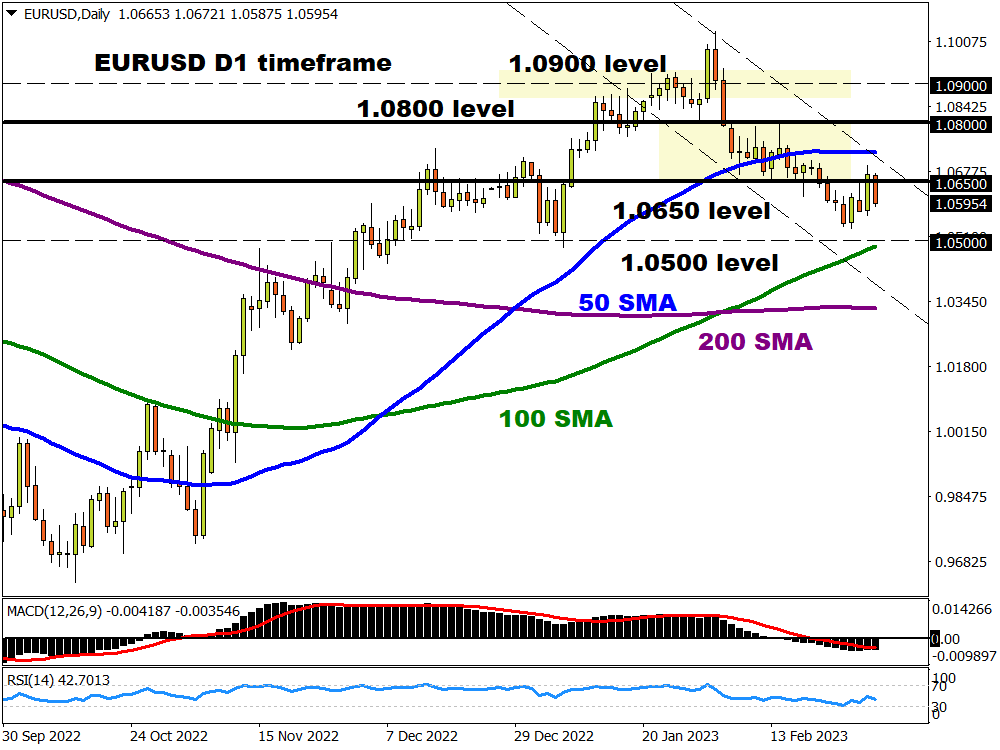
EURUSD to resume selloff?
Over the past few weeks, we have been closely observing the EURUSD. It has been a rollercoaster ride with prices swinging below and above the sticky 1.0650 level. Given how the overall trend remains bearish, this period of indecision could come to an end with 1.0500 acting as a key level of interest. While bears seem to be back in the game, it may be worth keeping a close eye on the Relative Strength Index (RSI) which is moving toward oversold levels. Should bulls fight back and send prices back above 1.0650, prices could rally toward 1.0800.

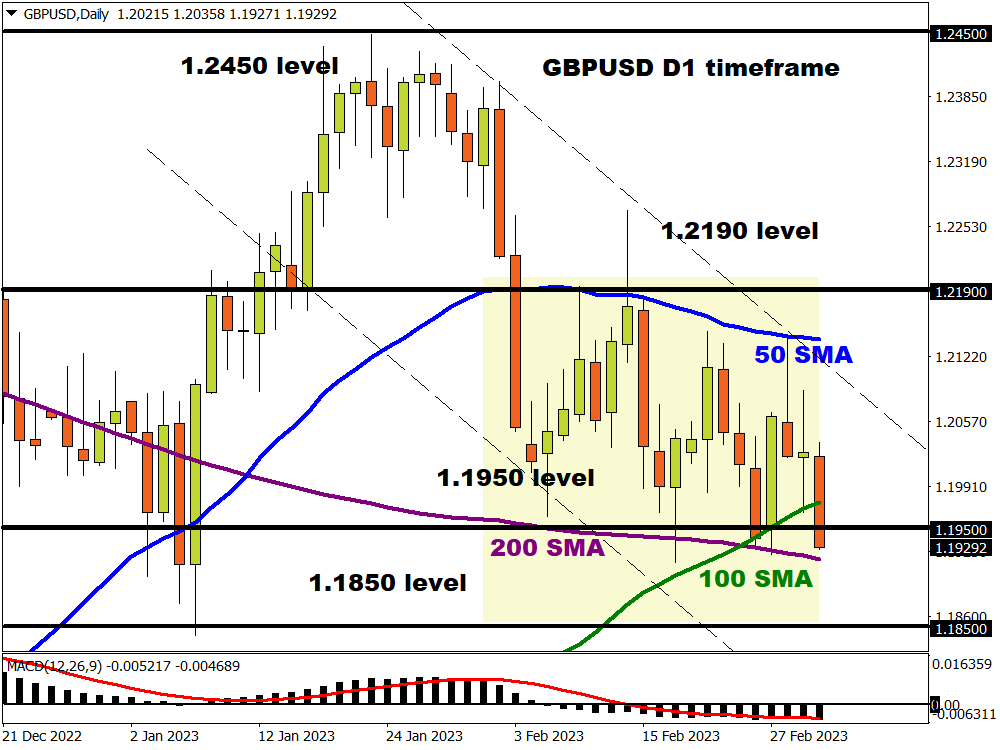
GBPUSD ready for bearish breakout?
After flirting around the 1.1950 level over the last few weeks, it looks like the GBPUSD could be gearing up for a bearish breakout. However, this could be a tough task for bears given how the 100 and 200-day Simple Moving Averages are in very close proximity. If bears can break through these multiple levels of support, the next key level of interest can be found at 1.1850.

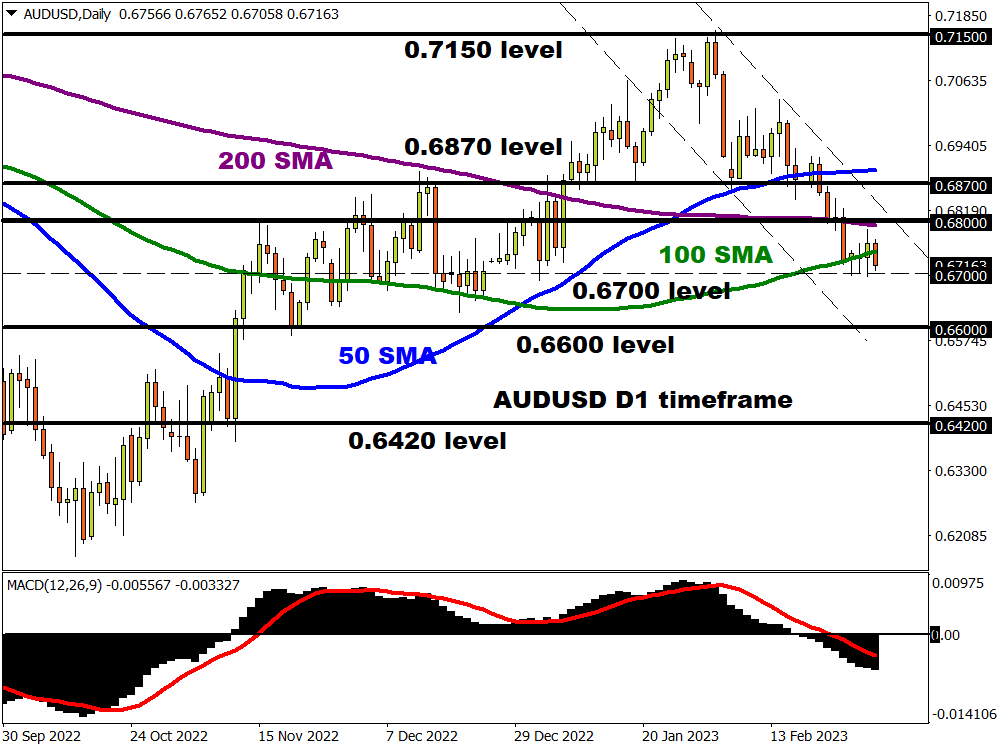
Time for AUDUSD to sell off?
A breakout could be on the horizon for the AUDUSD. Bears are hungry and pressing heavily on the 0.6700 support level. A strong breakdown below this point could encourage a selloff towards 0.6600 and 0.6420, respectively. If prices break back above the 0.6800 level, we could see an incline toward 0.6870.

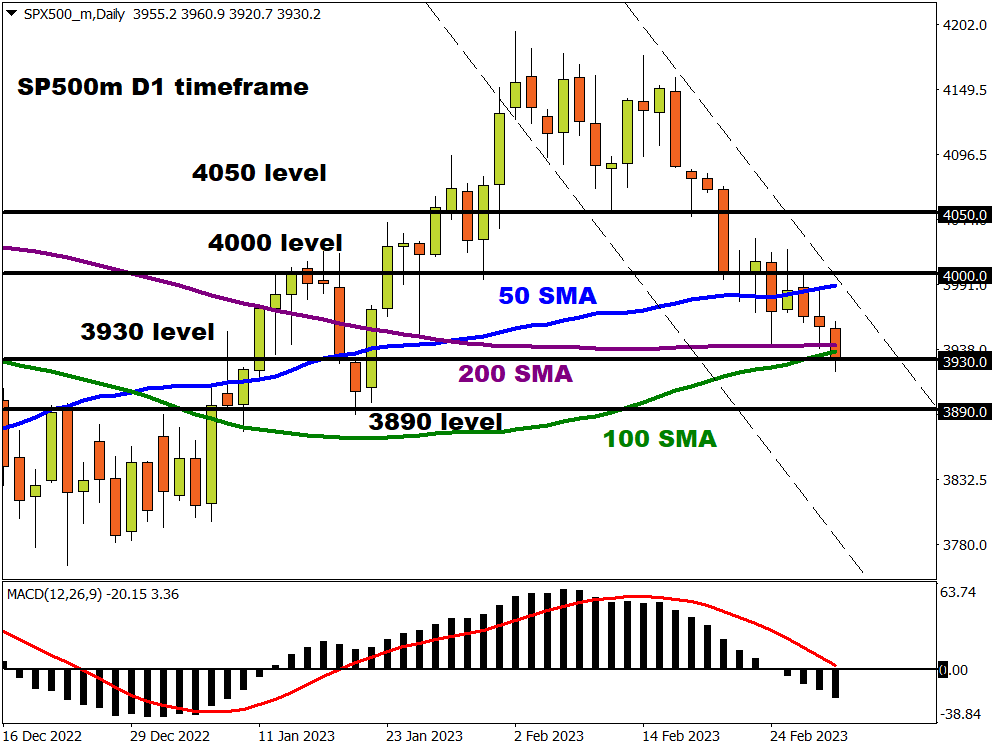
S&P500 under pressure
The S&P500 is under pressure on the daily charts and could trade lower if bears conquer the 3930 level. Given how this is where the 100 and 200-day Simple Moving Averages reside, this could be a tough task. However, a breakdown below this point may open the doors toward 3890. Alternatively, a rebound from this level could encourage a move back towards 4000.
