- USDInd bears take home 600 points!
- Soybean: No fireworks but H1 bullish target hit!
- EU50 secures ALL 4 bearish targets
The recent resurgence of the meme-stock mania and cooling US inflation data have certainly made this an eventful week for markets!
And more volatility could be on the horizon due to more data and speeches by numerous Fed officials.
Here are how these discussed instruments performed this week:
1) Dollar loosens grip on throne
- Where and when was Target Price (TP) published?
In our week ahead article published on Friday, 10th May:
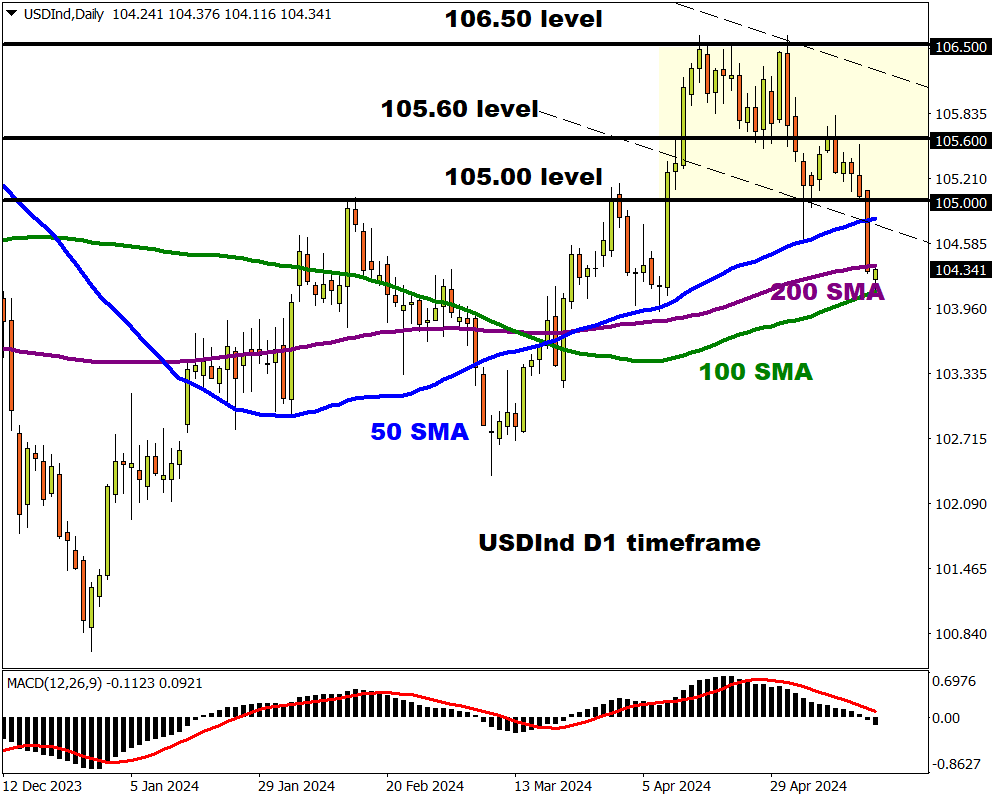
We discussed how this could be a volatile week for the USDInd due to high impact data.
Our technical section highlighted how a “solid breakdown below 105.00 could encourage a decline toward the 50-day SMA and 200-day SMA.”
- What happened since TP was published?
The USDInd collapsed like a house of cards on Wednesday after soft US inflation data reinforced bets around the Fed cutting rates in 2024.
Traders are now pricing in a 93% probability of a 25-basis point cut by September, with another one expected by December.
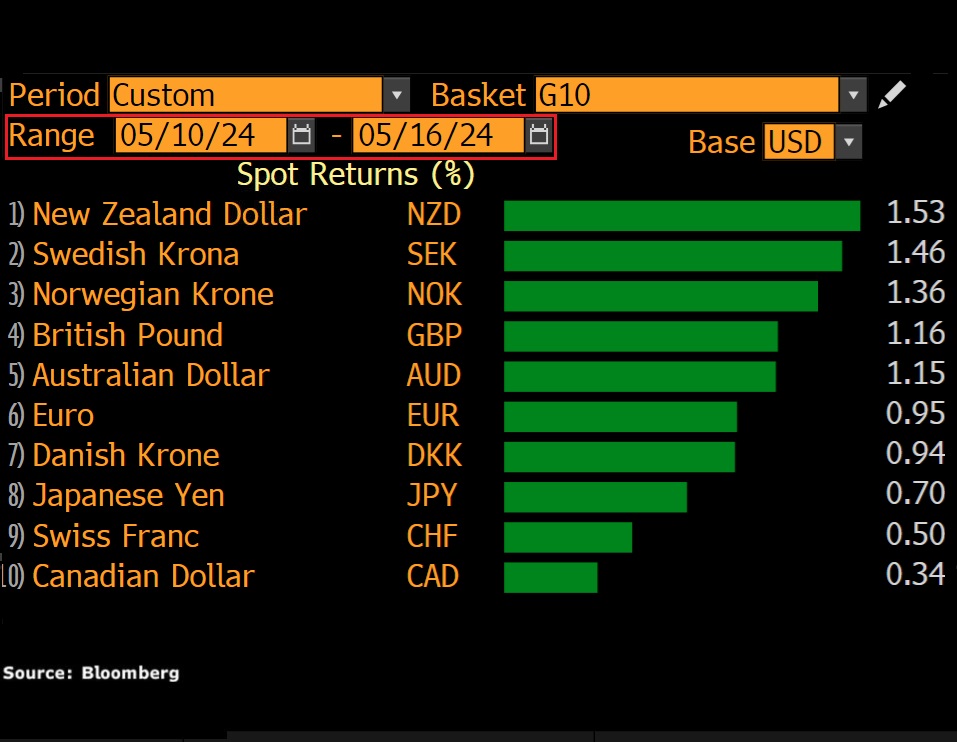
The dollar has weakened against every single G10 currency this week.

Note: USDInd could see more volatility this afternoon due to speeches from three Fed officials and more key data.
- How much in potential profits?
600 points for traders who entered the USDInd from the 105.00 level and exited at the 200-day SMA.

2) FXTM’s Soybean hits H1 target
- Where and when was Target Price (TP) published?
There were no fireworks or explosive moves on FXTM’s Soybean this week, but it remains on breakout watch.
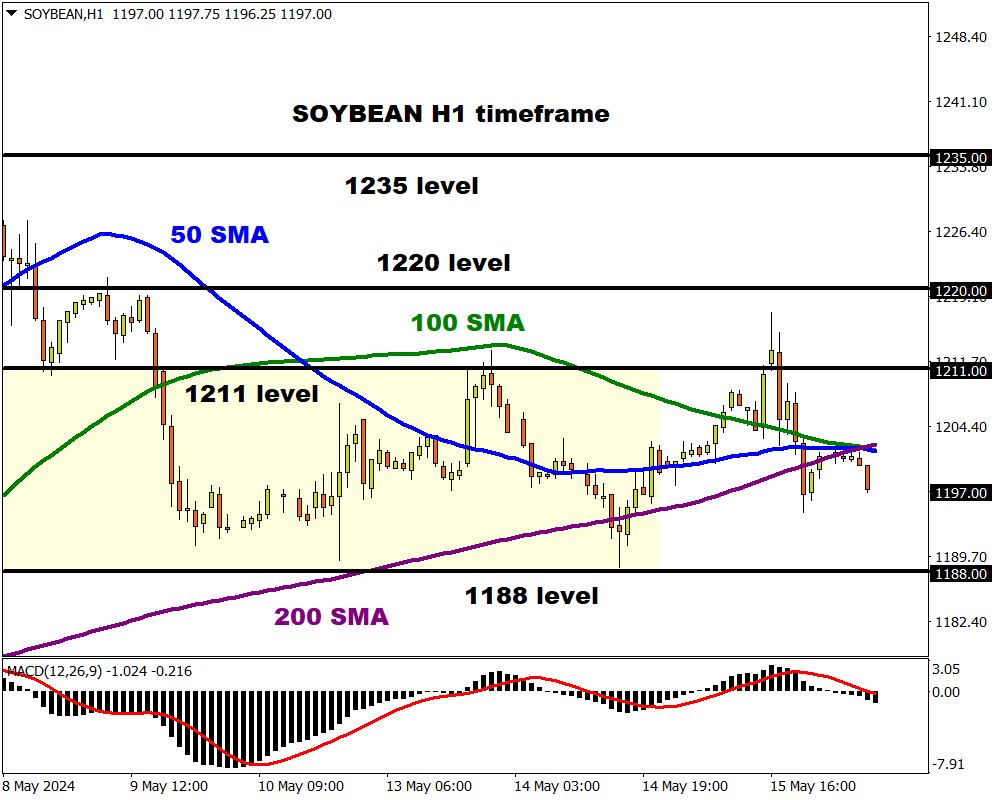
Still, on Tuesday we suggested that if “prices push back above the 50 SMA, this could open a path back to 1211.”
- What happened since TP was published?
As discussed earlier, prices were trapped within a range on the H1 timeframe this week.
After bouncing from the 1188 level and breaking above the 50 SMA, prices hit the 1211 target price on Wednesday.
- How much in potential profits?
Traders who took advantage of the breakout above the 50 H1 SMA and exited at 1211 would have caught a 1% move to the upside.

3) EU50 tumbles past all bearish targets
- Where and when was Target Price (TP) published?
This technical scenario (EU50) is based on the FXTM Signals that are released once a day, before the opening of the U.S. trading session.
These signals are designed around a trading instrument’s most influential factor – PRICE - making them a powerful asset to your trading strategy.
It can be found in the MyFXTM profile under Trading Services... FXTM Trading Signals.
- What happened since TP was published?
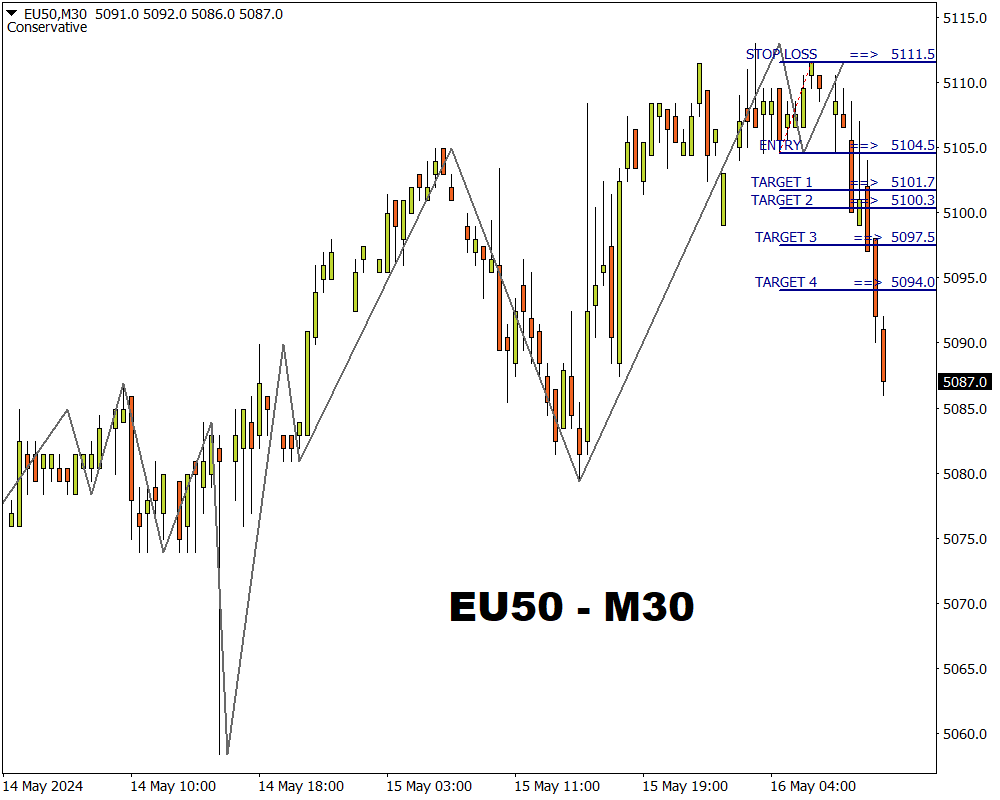
The EU50 was under pressure this morning due to downbeat corporate news from European companies.
- How much in potential profits?
EU50 has hit all 4 bearish targets.
Traders who entered at 5104.5 and exited at the final target level of 5094.0 would have gained roughly 10 pips.

Feel like you missed out on these profits?
You can keep following our "Daily Market Analysis" for fresh trading ideas and opportunities across global financial markets.