- Cotton ↑ 7% month-to-date
- Headed for first ↑ month since Feb
- Over 20% away from 2024 high
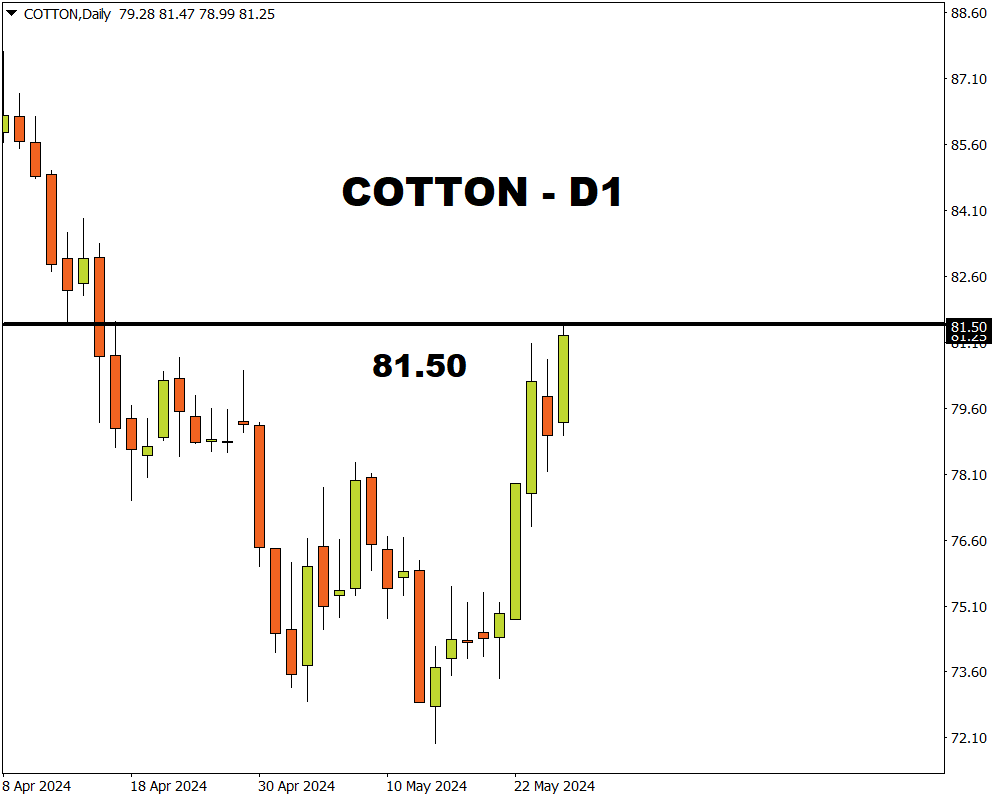
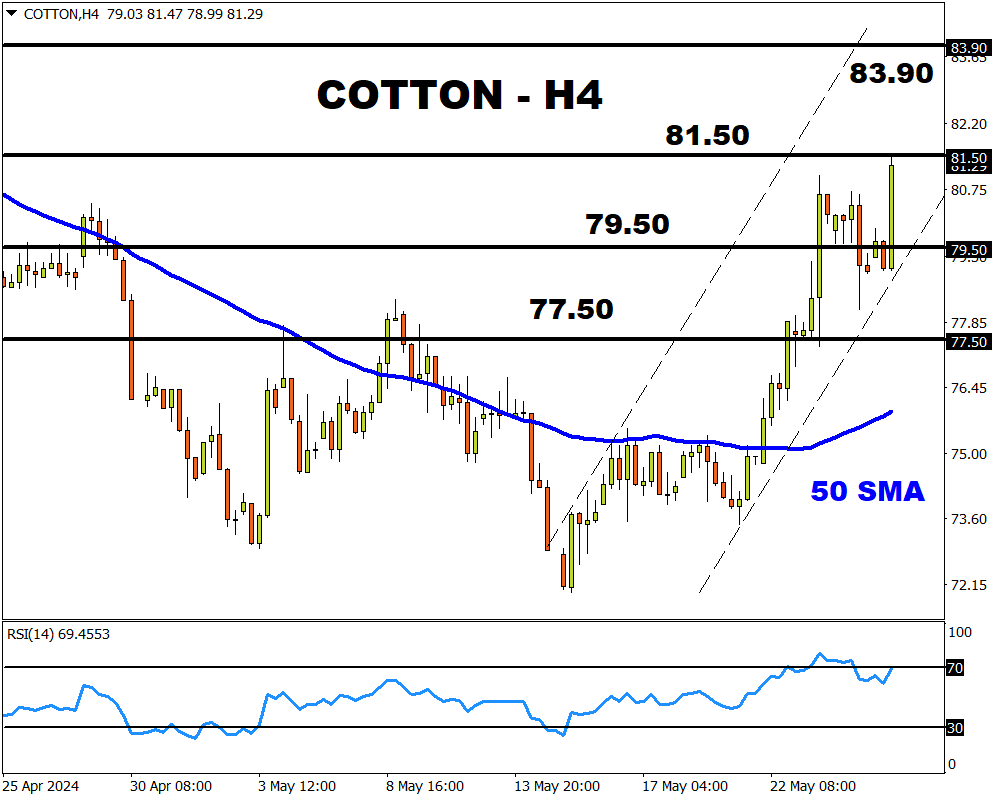
- H4 prices bullish but RSI overbought
- Technical levels – 83.90, 81.50, 79.50
FXTM’s new Cotton commodity could be set for a major rebound after ending last week on a firmly positive note.
Prices have recently hit a fresh multi-week high at 81.50 cents as bulls and bears wait for a fresh directional spark.

Note: Cotton is priced per pound.
Before we take a deep dive into the fundamentals, did you know that…
- Cotton is an ancient non-food crop
- China is the biggest producer & consumer
- Has been grown on the moon
- Most banknotes are made using cotton
- Hit an all-time high in 2011 at $2.27
What is Cotton?
Cotton is a soft and fluffy natural fiber made up from the seeds of a cotton plant.
It can be made into clothing, used for industrial products, and even fuel.
What does FXTM’s Cotton track
FXTM’s Cotton tracks the ICE Group’s Cotton No.2 futures, the benchmark for the global cotton trading community.
The lowdown
After trading within a narrow range for 16 months, cotton prices rallied in February 2024.
The commodity ended the month over 17% higher amid supply concerns in the United States.
However, prices later slipped in March with the selloff gaining momentum in April as slow demand and increased stocks dampened the market outlook.
The bigger picture
Due to conflicting fundamental forces, 2024 has been a rollercoaster year for cotton prices.
Still, prices seem to be stabilizing near one-month highs due to supply-related concerns and signs of strong demand from China.
Weather-related issues in Texas and flooding in Brazil are expected to affect the planting of cotton among other crops.
What does this mean?
Cotton prices may push higher if supply-related issues persist and global demand continues to improve.
According to the United States Department of Agriculture (USDA), U.S. cotton demand is projected to increase in 2024/2025 but global production is also projected to rise 5% above the 2023/2024 estimate.
Technical outlook…
Prices are bullish on the D1/H4 timeframe with the upside gaining momentum above 79.50.
However, the Relative Strength Index (RSI) has touched 70 – indicating that prices are overbought on the H4 timeframe.
- A solid breakout above 81.50 could encourage a move towards 83.90.
- Should prices slip back under 79.50, this may open a path towards 77.50 and the 50 SMA.
