Key Events:
- US CPI Data: Risks of inflation edging higher ahead of next week’s FOMC meeting.
- Middle East Reforms: Escalation continues with the fall of the Syrian government.
- China Policy Shift: First major easing monetary policy shift announced since 2011.
- UK Job Market: Job vacancies fall to a 4-year low.
- UK GDP Report: Final GBP catalyst arrives Friday, following US inflation and unemployment data.
Following this week’s US CPI data, market sentiment is expected to shift ahead of the final volatility risks before the holidays. Flash PMI indicators from the UK, US, and EU, combined with monetary policy decisions from the Fed, BOJ, and BOE, are expected shape market dynamics.
The dynamics are expected to shift between anticipation for this week and reactions in the next. China, for the first time since 2011, has shifted its monetary policy stance, preparing for potential trade war risks in 2025 under Trump’s presidency. This move introduces heightened risks for neighboring central banks as they navigate uncertain economic landscapes.


Middle East Reforms, 2025 Geopolitics, and Haven Investments
The Middle East is witnessing significant geopolitical shifts. Following the ceasefire deal between Israel and Lebanon, another major development emerged with the fall of the Syrian government, further diminishing Iran's influence in the region.
While these transformations are underway, the risk of supply disruptions and new conflicts persists until comprehensive agreements are reached. These uncertainties continue to support demand for haven assets while keeping key trendlines in focus
Technical Analysis: Quantifying Uncertainties
GBPUSD Analysis: Daily Time Frame – Log Scale

Source: Trading view
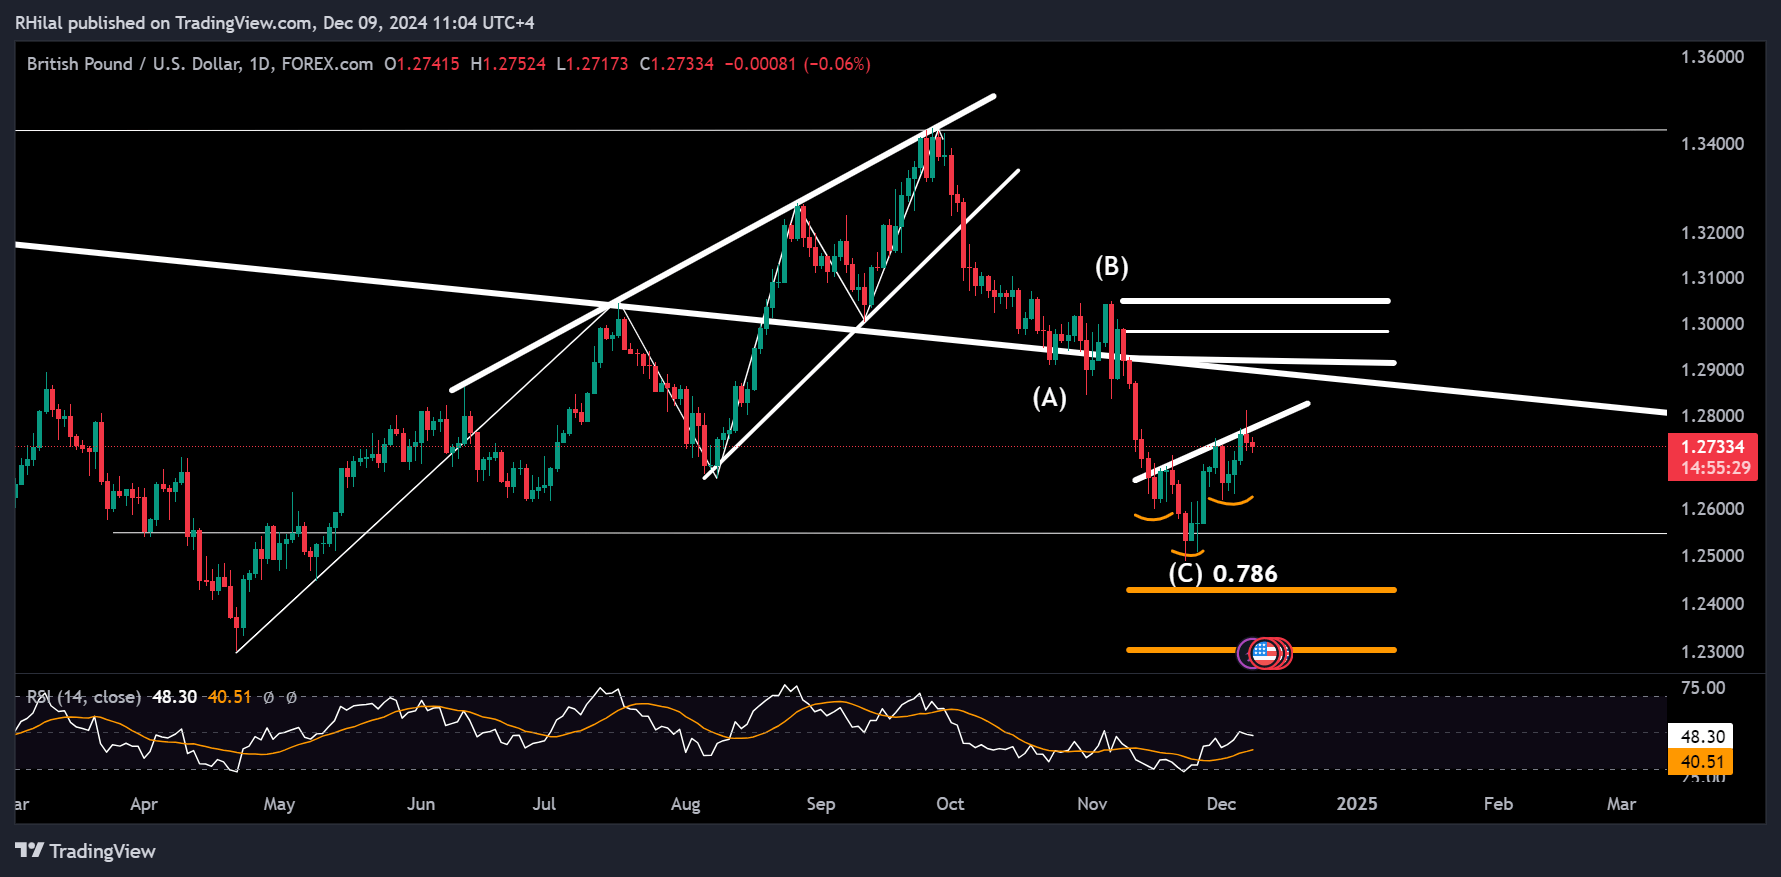
After the Dollar's rally, GBPUSD retraced to the 0.786 Fibonacci level of the April-September uptrend at 1.2487, forming a 3-wave correction pattern (ABC in Elliott Wave theory). The pair has rebounded from the 1.2487 low, potentially forming an inverted head-and-shoulders pattern. However, confirmation requires a breakout above the neckline at 1.2770.
Resistance levels in sight align with the trendline connecting the highs between 2016 and 2021 and above, at 1.2760, 1.2980, and 1.3050. From the RSI perspective, GBPUSD rebounded from oversold levels not seen since April 2024, but it remains below the neutral 50-zone resistance. Failure to break higher could redirect the trend toward deeper support levels.
From the downside, if the pound loses its ground below the 1.2470 low, the next support levels in sight lie at 1.2430 and 1.23.
Gold Analysis: 3Day Time Frame – Log Scale

Source: Tradingview
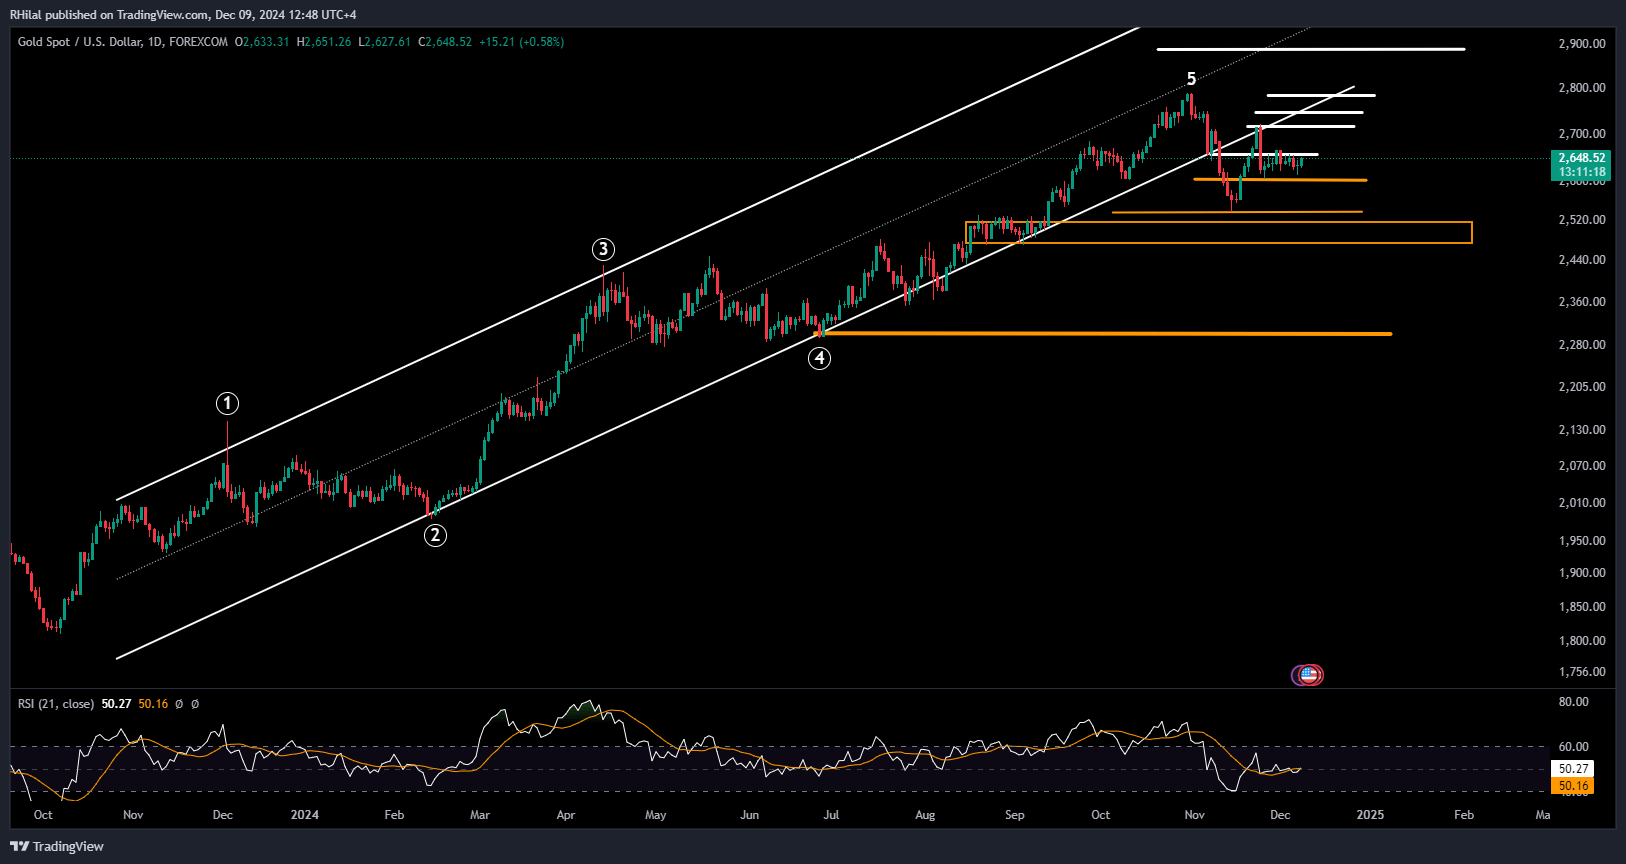
Gold remains in a tight consolidation range between 2600 and 2660, under pressure from Dollar and 2025 uncertainty, and geopolitical risks. Price action is still leaning bearish, staying below the year-long trendline and channel. However, a break above 2760 could reignite the primary uptrend.
The bullish track and resistance levels for gold are seen at: 2660 – 2720 – 2760 – 2800 – 2890 – 3,050.
From the downside, a firm break below the 2600 mark can extend gold’s drop back towards the extremity following the US elections at 2540, where RSI retested levels previously seen in February 2024, with further downside risks towards support levels at 2520, 2480 and in a more extreme scenario, at 2300.
--- Written by Razan Hilal, CMT on X: @Rh_waves and Forex.com Youtube