Key Events:
- Crude Oil regains momentum above the $70 barrier
- Gold surges towards November highs, touching $2,726 per ounce
- OPEC reports a 5th consecutive downward revision for oil prices in 2024
- China’s crisis-era policy language lifts sentiment for commodities
China’s Moderately Loose Monetary Policy – What’s in It?
Besides OPEC’s 5th consecutive downward revision for oil prices in 2024, bullish sentiment from China’s economic outlook for 2025 has pushed oil prices into the $70–72 resistance zone, while gold remains in a neutral to bullish stance at $2720 per ounce. This is further supported by geopolitical risks in the Middle East.

The last time China adopted a “moderately loose” monetary policy was during the 2008–2009 financial crisis to stimulate its economy. This approach included interest rate cuts, reserve requirement ratio reductions, and increased fiscal spending, which spurred rapid credit expansion, inflation, and economic growth.
However, these measures were later scaled back with a prudent policy in 2011 to mitigate bubble risks. The specifics of China’s 2025 monetary policy remain unclear, but a similarly drastic approach is anticipated ahead of Trump’s trade wars.

Middle East and Conflict Peaks Ahead of Trump Presidency
In addition to China’s policy stance, Trump has vowed to address ongoing Middle East conflicts, threatening harsh measures if resolutions are not reached before his presidency resumes. This has escalated tensions in the region, including the weakening of Iranian proxies and the recent fall of the Assad regime in Syria.
These developments increase hedging risks for commodities including oil until concrete resolutions are achieved.
Technical Analysis: Quantifying Uncertainties
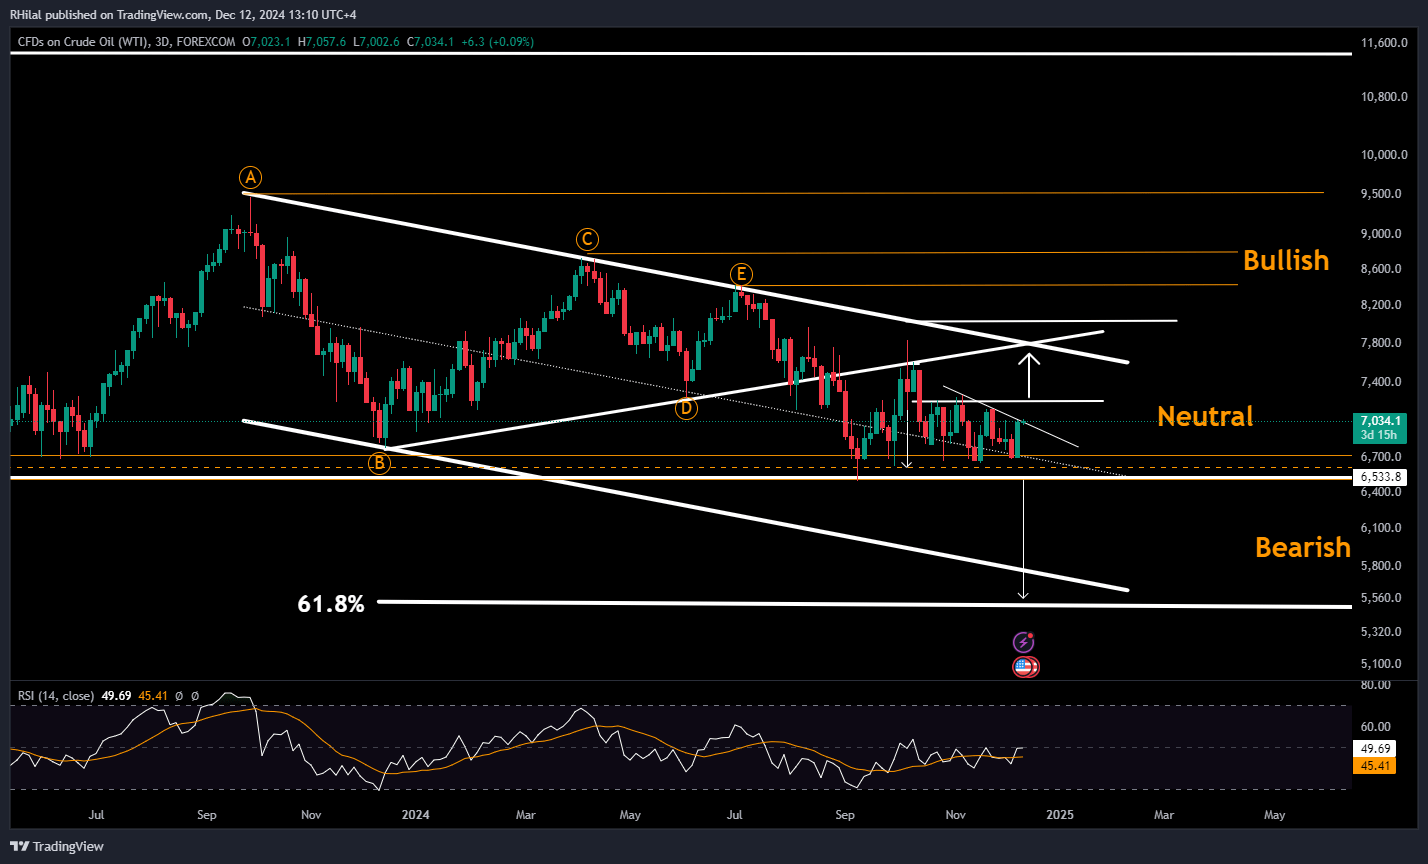
Crude Oil Forecast: 3Day Time Frame – Log Scale

Source: Tradingview
Oil extended yet another shoulder on its chart, back up at the 70-resistance level, aligning with the resistance line connecting consecutive lower highs between November and December. Short-term resistance lies at November’s highs, between $72 and $72.70, with a breakout potentially targeting the triangle’s trough at $78 and the $80 zone. Downside risks remain below the $68–64 zone, with further declines toward $60, $55, and $49.
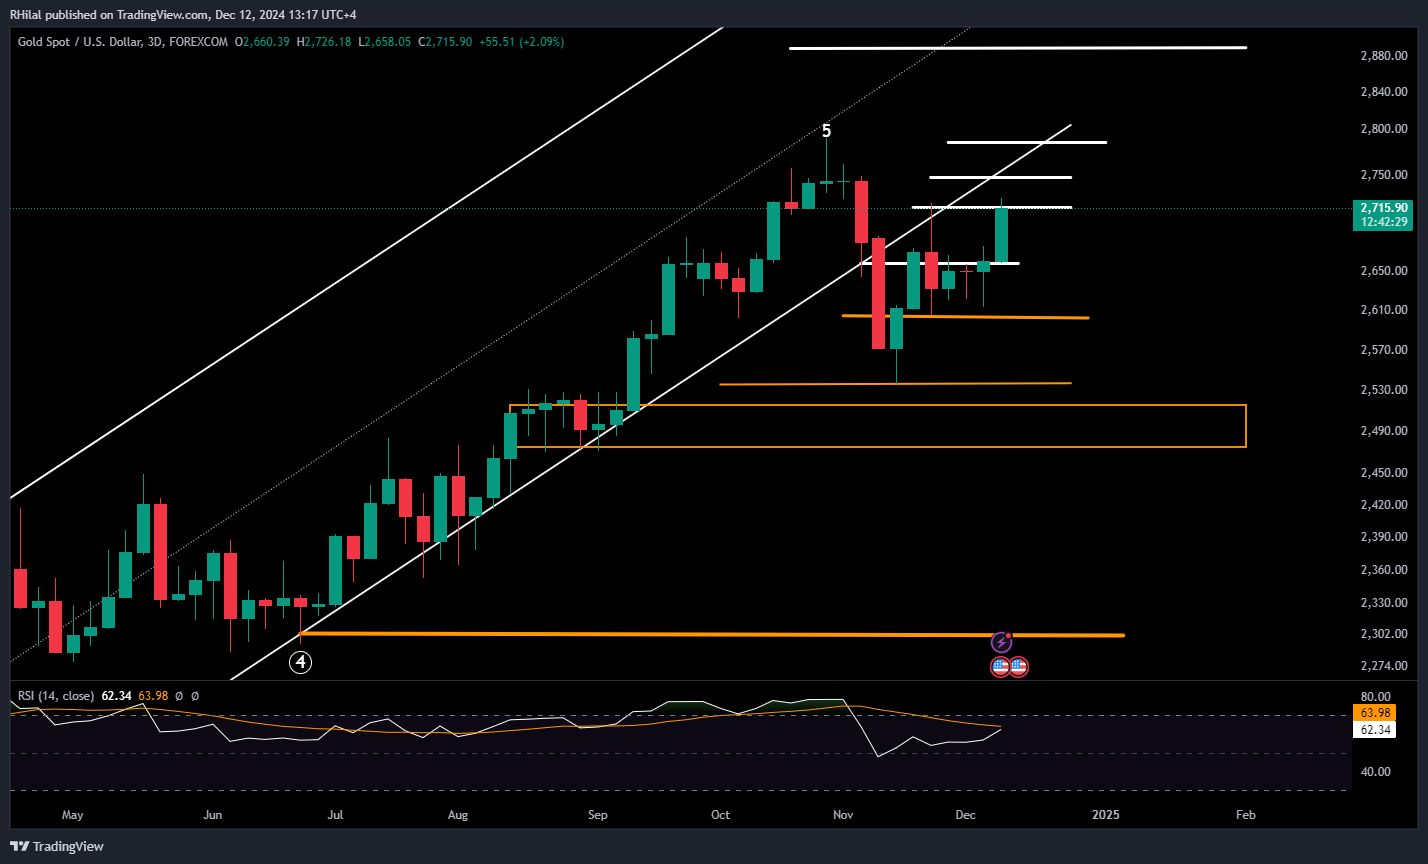
Gold Forecast: 3Day Time Frame – Log Scale

Source: Tradingview
Gold’s primary uptrend remains in question as it trades below the borders of its 2022–2023 ascending channel. Currently, gold is testing the $2,720 resistance, aligned with November highs, approaching the lower border of the channel near its all-time highs between $2,750 and $2,790. A firm break above $2,800 could extend gains toward $2,890 and $3,050. On the downside, a break below the $2,660 and $2,600 support zones could revive bearish risks, targeting $2,530 and $2,480.
--- Written by Razan Hilal, CMT on X: @Rh_waves and Forex.com You Tube