Gold Talking Points:
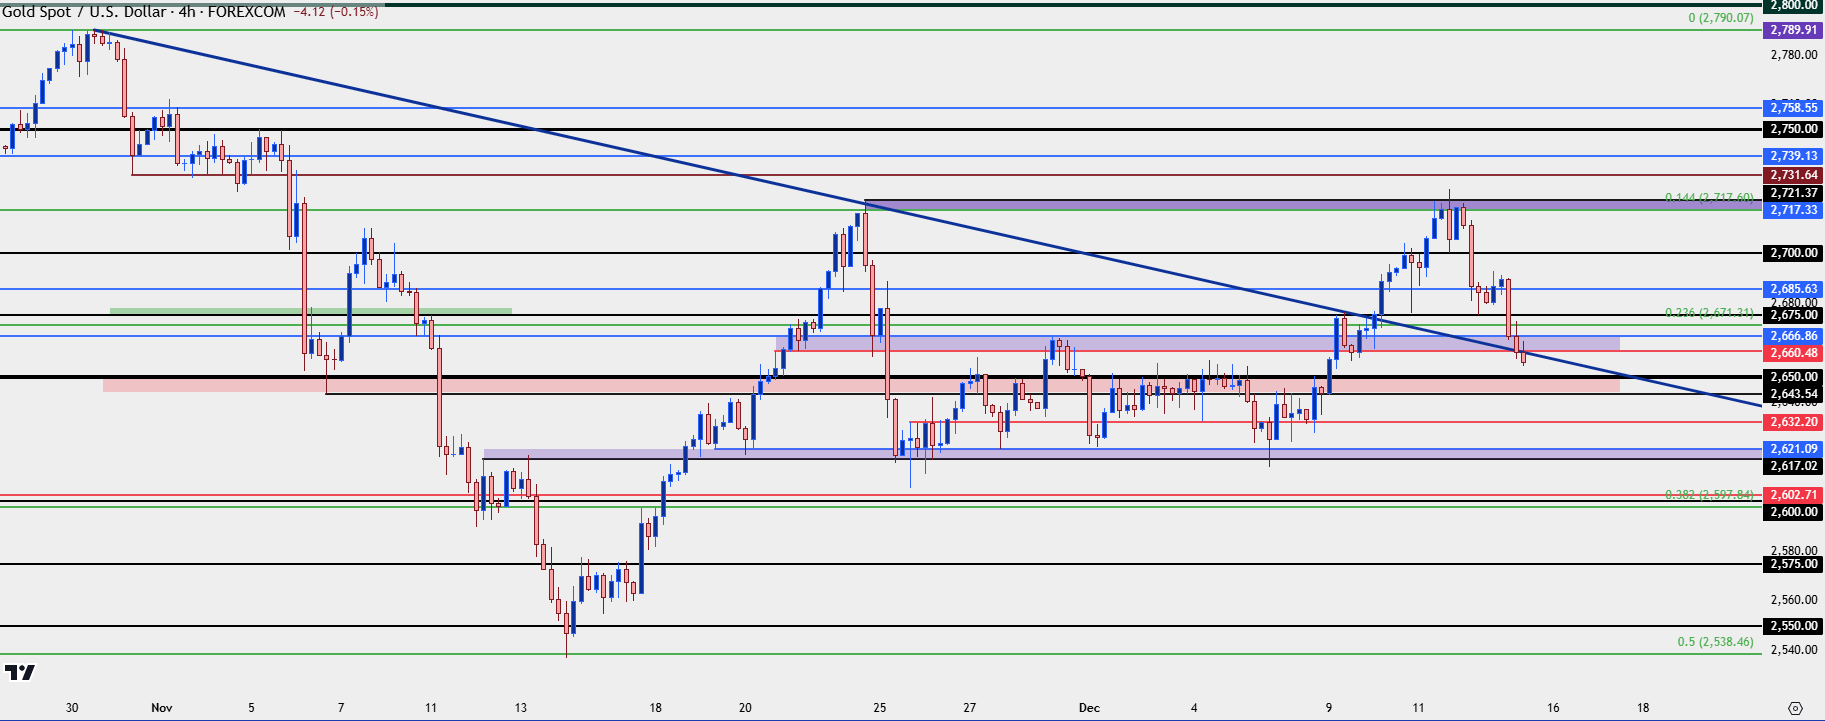
- Gold prices told a tale of two trends last week as early-trade saw bulls break the prior range, until resistance showed at the 2717-2721 level.
- I had looked at that resistance on Wednesday before it came into play and that’s ultimately what stopped gold bulls in their tracks, creating a sizable reversal in the back-half of the week.

Gold prices had a hopeful start to the week as the metal continued a rally from range support that started a week prior. The range itself was a hopeful item as it marked a period of calm following the steep sell-off that developed on the back of the U.S. Presidential Election in November.
The election-fueled sell-off led into the largest weekly bounce since March of 2023, right around the time the regional banking crisis came into play in the U.S.; but it was the pullback from that rally that led into the range spanning through the November close and the December open.
This week’s rally technically set a fresh monthly high at the highest level that’s traded since the day after the election. But much like we saw a few weeks ago, the 2717-2721 resistance zone held the highs and delivered a pullback that’s spanning into the weekly close.
Gold Four-Hour Price Chart
 Chart prepared by James Stanley; data derived from Tradingview
Gold Short-Term Support
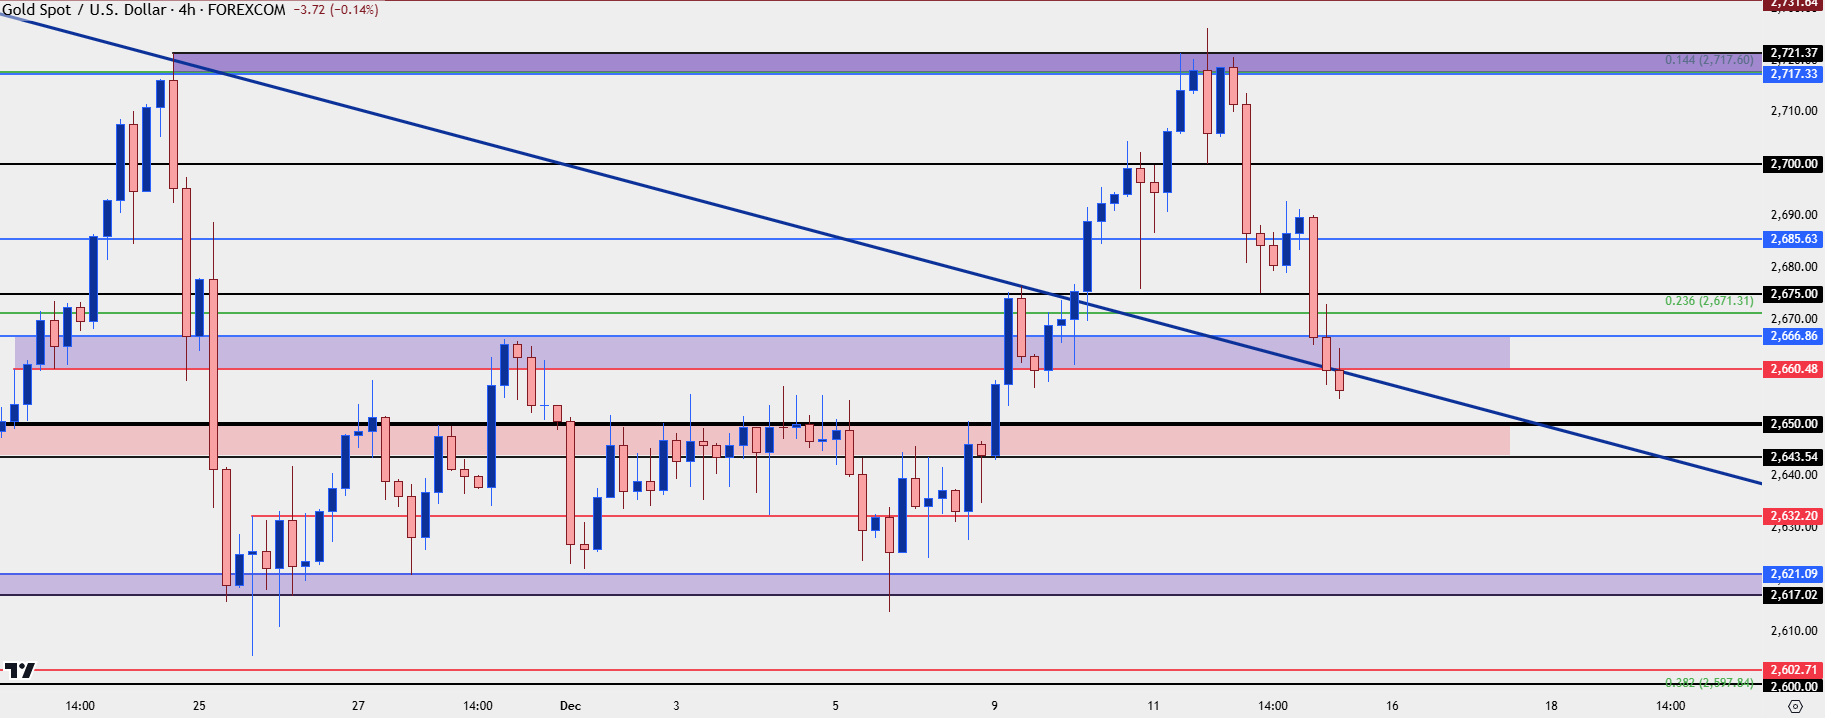
At this point there’s already been a few attempts from bulls to build a support bounce, but those have largely failed since the resistance test on Wednesday.
There was an initial bounce from 2700 but that led to a lower-high. And then another bounce from 2675 that similarly led to a lower-high. As we push towards the end of the week, the 2660-2666 zone has similarly been traded through.
At this point, the next item of support is a big one, as this was prior range resistance from early-December, and it spans from 2643-2650.
Gold Four-Hour Chart
 Chart prepared by James Stanley; data derived from Tradingview
Gold Bigger Picture
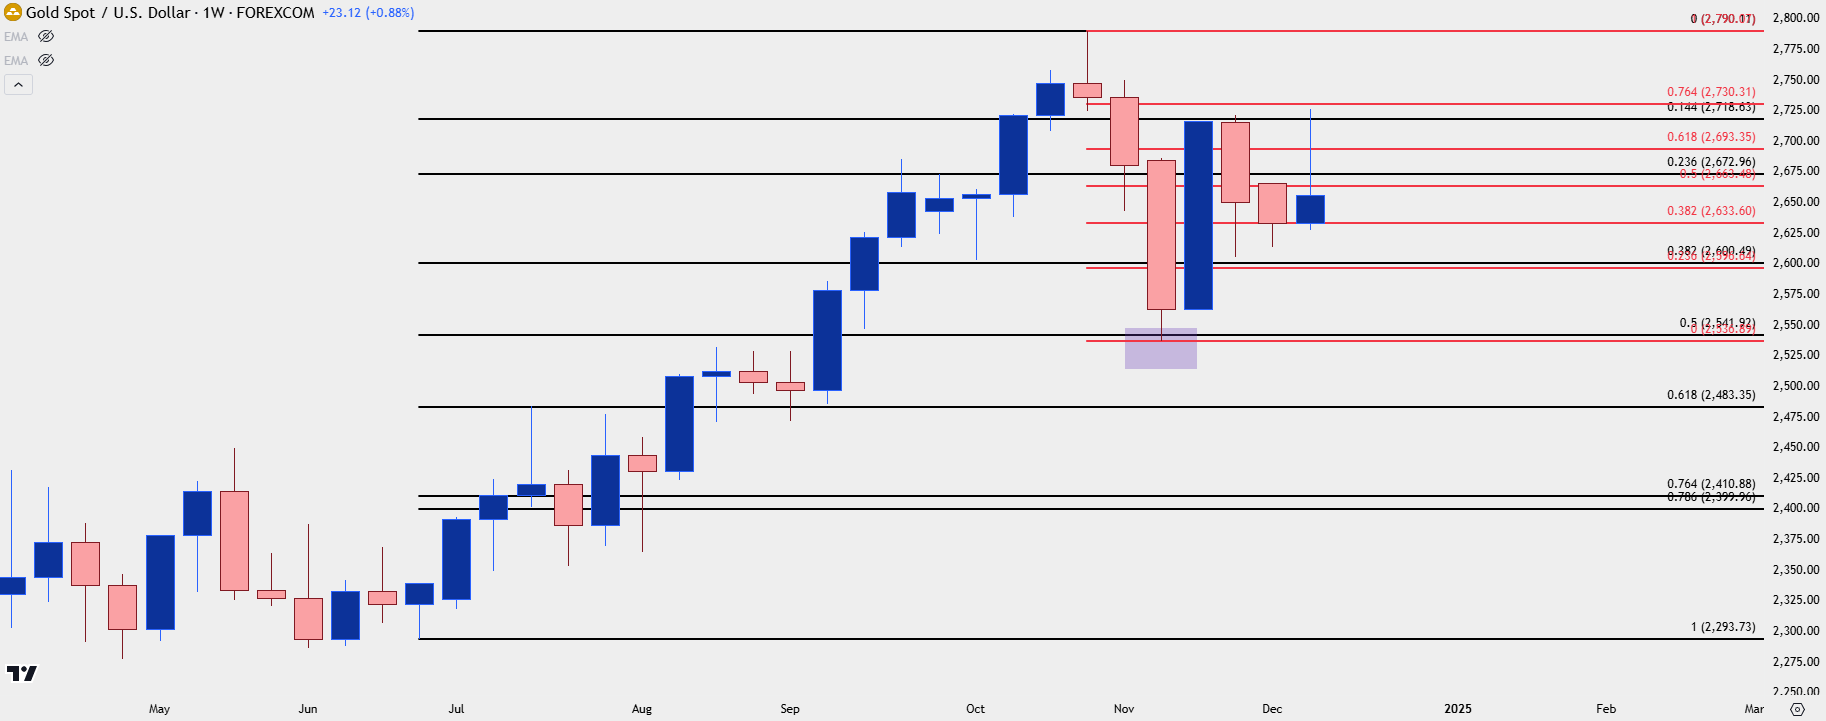
It’s been a massive year for gold bulls as the metal has gained as much as 40% from the February lows and currently 28.79% on the year. That yearly gain would be the largest since 2010 if it holds and in that prior instance, gold prices continued to run higher into the next year before eventually setting a high and reversing.
I think the fact that profit taking hasn’t reversed a larger portion of the move is a deductively bullish item, and I’ll probably retain that view until sellers are able to take out key supports at 2600 and then the 2538 level that caught the lows in November. But, with that said, given the intra-week reversal and the upper wick sitting atop the weekly candle, there’s no sign yet that the current round of consolidation is completed, and this is something that would caution against chasing the move-higher.
For supports, the first item of interest is range support from 2617-2621 as that zone had held the low son multiple occasions before the rally that ran into last week’s open. But, below that, it’s the 2600 level that sticks out and then the 2538-2540 area on the chart.
Gold Weekly Chart
 Chart prepared by James Stanley; data derived from Tradingview
--- written by James Stanley, Senior Strategist
Gold Talking Points:
- Gold prices told a tale of two trends last week as early-trade saw bulls break the prior range, until resistance showed at the 2717-2721 level.
- I had looked at that resistance on Wednesday before it came into play and that’s ultimately what stopped gold bulls in their tracks, creating a sizable reversal in the back-half of the week.
Gold AD
Gold prices had a hopeful start to the week as the metal continued a rally from range support that started a week prior. The range itself was a hopeful item as it marked a period of calm following the steep sell-off that developed on the back of the U.S. Presidential Election in November.
The election-fueled sell-off led into the largest weekly bounce since March of 2023, right around the time the regional banking crisis came into play in the U.S.; but it was the pullback from that rally that led into the range spanning through the November close and the December open.
This week’s rally technically set a fresh monthly high at the highest level that’s traded since the day after the election. But much like we saw a few weeks ago, the 2717-2721 resistance zone held the highs and delivered a pullback that’s spanning into the weekly close.
Gold Four-Hour Price Chart
 Chart prepared by James Stanley; data derived from Tradingview
Gold Short-Term Support
At this point there’s already been a few attempts from bulls to build a support bounce, but those have largely failed since the resistance test on Wednesday.
There was an initial bounce from 2700 but that led to a lower-high. And then another bounce from 2675 that similarly led to a lower-high. As we push towards the end of the week, the 2660-2666 zone has similarly been traded through.
At this point, the next item of support is a big one, as this was prior range resistance from early-December, and it spans from 2643-2650.
Gold Four-Hour Chart
 Chart prepared by James Stanley; data derived from Tradingview
Gold Bigger Picture
It’s been a massive year for gold bulls as the metal has gained as much as 40% from the February lows and currently 28.79% on the year. That yearly gain would be the largest since 2010 if it holds and in that prior instance, gold prices continued to run higher into the next year before eventually setting a high and reversing.
I think the fact that profit taking hasn’t reversed a larger portion of the move is a deductively bullish item, and I’ll probably retain that view until sellers are able to take out key supports at 2600 and then the 2538 level that caught the lows in November. But, with that said, given the intra-week reversal and the upper wick sitting atop the weekly candle, there’s no sign yet that the current round of consolidation is completed, and this is something that would caution against chasing the move-higher.
For supports, the first item of interest is range support from 2617-2621 as that zone had held the low son multiple occasions before the rally that ran into last week’s open. But, below that, it’s the 2600 level that sticks out and then the 2538-2540 area on the chart.
Gold Weekly Chart
 Chart prepared by James Stanley; data derived from Tradingview
--- written by James Stanley, Senior Strategist