Canada Dollar Outlook: USD/CAD
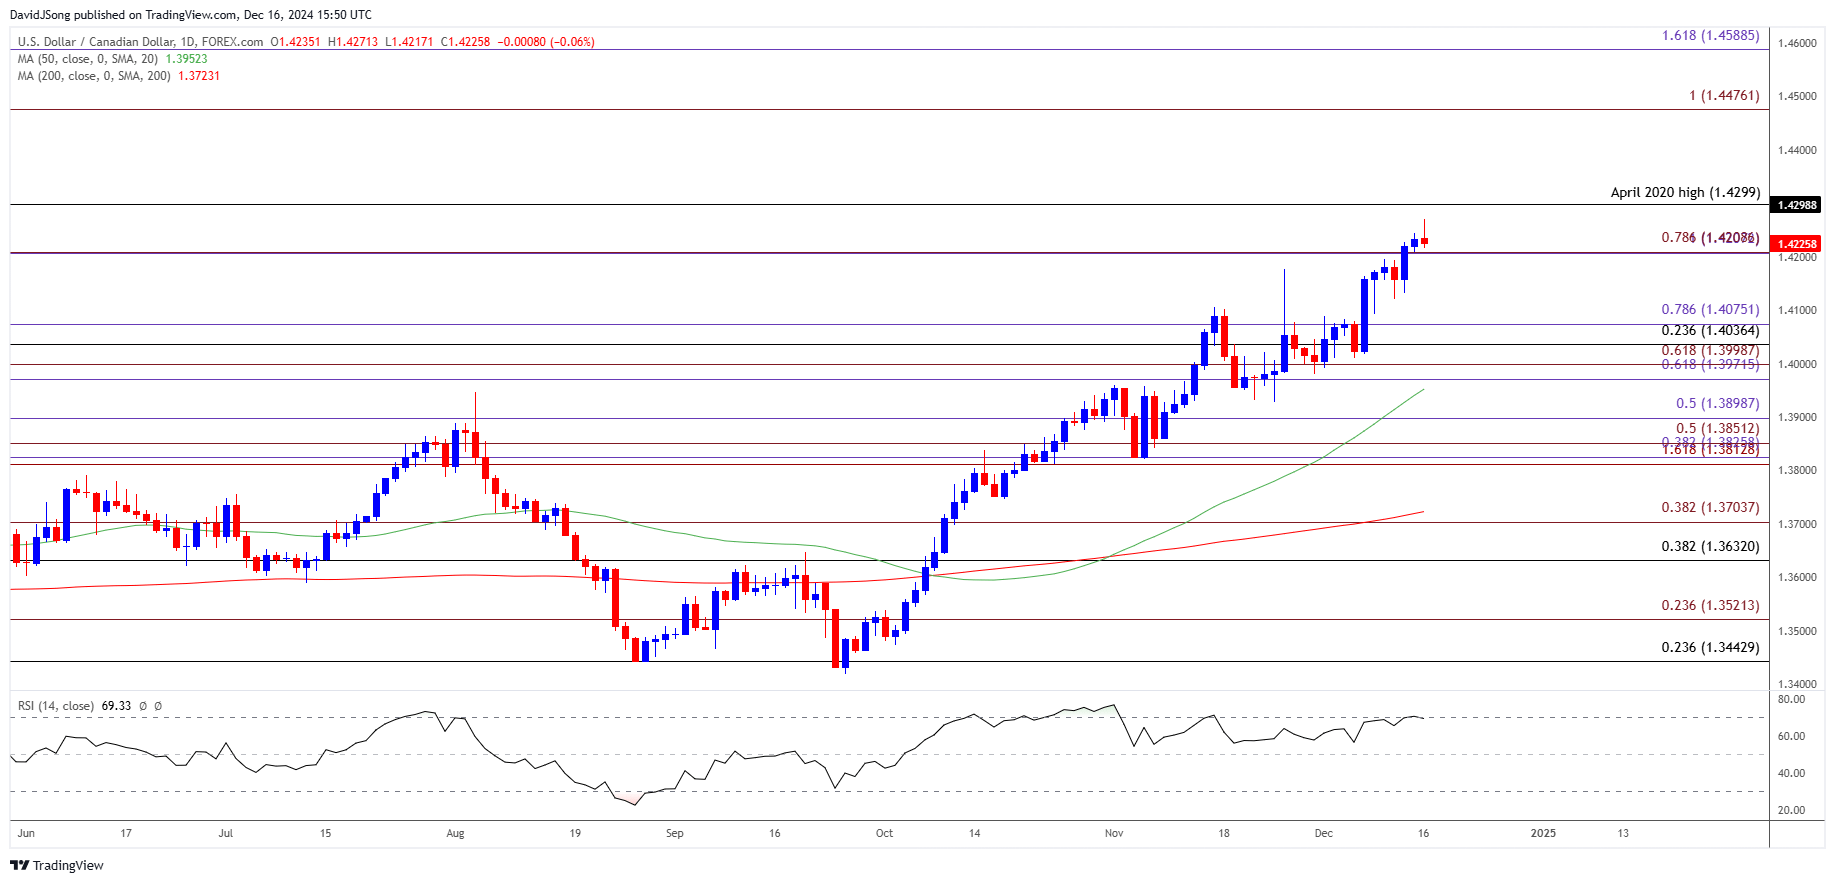
USD/CAD pulls back from a fresh yearly high (1.4271) to keep the Relative Strength Index (RSI) below overbought territory, but a move above 70 in the oscillator is likely to be accompanied by a further advance in the exchange rate like the price action from earlier this year.
USD/CAD Pullback Keeps RSI Below Overbought Territory
USD/CAD may attempt to test the April 2020 high (1.4299) as it continues to carve a series of higher highs and lows, and the exchange rate may track the positive slope in the 50-Day SMA (1.3953) as it holds above the moving average.
Join David Song for the Weekly Fundamental Market Outlook webinar.
David provides a market overview and takes questions in real-time. Register Here Canada Economic Calendar
At the same time, the update to Canada’s Consumer Price Index (CPI) may do little to curb the rise in USD/CAD as the headline reading for inflation is expected to hold steady at 2.0%, and the Bank of Canada (BoC) may keep the door open to implement lower interest rates as the central bank pledges to ‘support growth and keep inflation close to the middle of the 1-3% target range.’
In turn, USD/CAD may continue to appreciate ahead of the Federal Reserve interest rate decision on December 18, but a higher-than-expected CPI print may generate a bullish reaction in the Canadian Dollar as Governor Tiff Macklem and Co. reveal that ‘we will be evaluating the need for further reductions in the policy rate one decision at a time.’
With that said, USD/CAD may struggle to test the April 2020 high (1.4299) if it fails to extend the bullish price series, but the RSI may show the bullish momentum gathering pace should it push above 70 and climb into overbought territory.
USD/CAD Price Chart – Daily

Chart Prepared by David Song, Strategist; USD/CAD Price on TradingView
- USD/CAD continues to appreciate after staging a four-week rally, with the exchange rate climbing to a fresh yearly high (1.4271) as it extends the bullish price series from last week.
- A breach above the April 2020 high (1.4299) opens up 1.4480 (100% Fibonacci extension), with the next area of interest coming in around 1.4590 (161.8% Fibonacci extension).
- At the same time, lack of momentum to push above the April 2020 high (1.4299) may pull the Relative Strength Index (RSI) back from overbought territory, with a move below 1.4210 (78.6% Fibonacci extension) bringing the 1.4040 (23.6% Fibonacci retracement) to 1.4080 (78.6% Fibonacci extension) area back on the radar.
Additional Market Outlooks
US Dollar Forecast: EUR/USD Attempts to Halt Five-Day Selloff
USD/JPY Stages Five-Day Rally for First Time Since June
Gold Price Forecast: Bullion Remains Below Pre-US Election Prices
GBP/USD Outlook Hinges on Break of December Opening Range
--- Written by David Song, Senior Strategist
Follow on Twitter at @DavidJSong
