Gold Technical Forecast: XAU/USD Weekly Trade Levels
- Gold defends support for sixth-consecutive week- January opening-range in focus
- XAU/USD threat remains for larger correction with broader uptrend- NFPs on tap next week
- Resistance 2736 (key), 2804, 2900– Support 2607, 2532, 2450/82 (key)
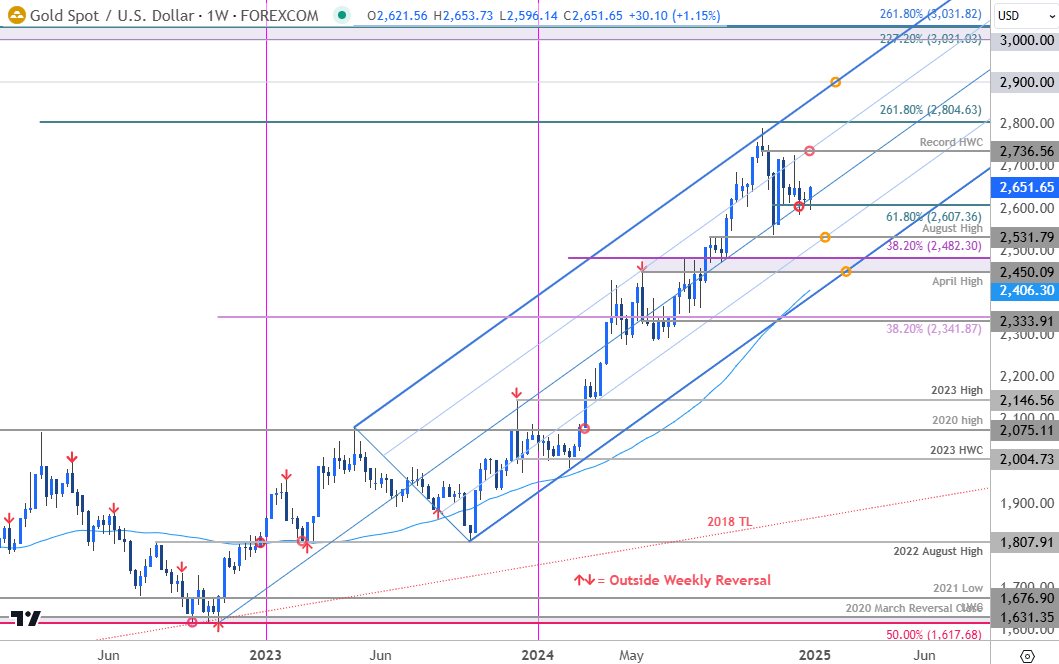
Gold prices are poised to close the week up more than 1.1% as XAU/USD rebounds off technical support for a sixth-consecutive week. The focus remains on a breakout of a critical range heading into the January open with the broader uptrend still vulnerable while below the record high-close. Battle lines drawn on the XAU/USD weekly technical chart.
Review my latest Weekly Strategy Webinar for an in-depth breakdown of this gold setup and more. Join live on Monday’s at 8:30am EST.Gold Price Chart – XAU/USD Weekly

Chart Prepared by Michael Boutros, Sr. Technical Strategist; XAU/USD on TradingView
Technical Outlook: In last month’s Gold Weekly Price Forecast we noted that the gold was trading into multi-year uptrend support and, “while the broader outlook remains constructive, the advance may be vulnerable to a larger correction within the broader uptrend. From a trading standpoint the immediate focus is on a breakout of the 2607-2736 range for guidance.”
It has been nearly a month, and the gold levels remain unchanged into the start of the year with XAU/USD defending support this week at the 61.8% retracement of the November rally at 2607. A break below the median-line would be needed to suggest a larger correction is underway here with initial support objectives seen at the August high at 2531 and 2450/82- a region defined by the April swing high and the 38.2% retracement of the 2024 trading range. We will reserve this threshold as our bullish invalidation level and losses would need to be limited to this slope for the late-2023 uptrend to remain viable.
Resistance is eyed with the record high-week close (HWC) at 2736 and is backed by the 2.618% extension of the 2022 range-break at 2804- a breach / weekly close above this level is needed to fuel the next major leg of the rally towards subsequent objectives at 2900 and 3000/31- a region defined by the 2.272% extension of the 2011 decline and the 1.618% extension of the 2022 advance. Look for a larger reaction there IF reached.
<div data-site="cityindex"><span data-ee-only="true">This image will only appear on cityindex websites!</span><br data-ee-only="true" />
<p><a href="/market-outlooks-2024/Q4-gold-outlook/" target="_blank" gtmlinkname="Download Gold" gtmlinkcontext="Market Outlook Banner"><img alt="Get our exclusive guide to gold trading in Q4 2024" src="/en-us/-/media/project/gain-capital/city-index/banners/campaigns/market-outlook/2024/q4/ci-banner-gold-fx-horizontal-v2.jpg" style="height:347px; width:1000px;" data-zoomable-image="true" class="prevent-zoom" /></a></p>
</div>
<div data-site="forex"><span data-ee-only="true">This image will only appear on forex websites!</span><br data-ee-only="true" />
<p><a href="/market-outlooks-2024/Q4-gold-outlook/" target="_blank" gtmlinkname="Download Gold" gtmlinkcontext="Market Outlook Banner"><img alt="Get our exclusive guide to gold trading in Q4 2024" src="/en-us/-/media/project/gain-capital/forex/banners/campaigns/market-outlook/2024/q4/fx-banner-gold-fx-horizontal-v2.jpg" style="height:347px; width:1000px;" data-zoomable-image="true" class="prevent-zoom" /></a></p>
</div>
Bottom line: Gold is trading into a multi-year slope support into the start of the December and the focus is on a reaction off the median-line early in the month. From a trading standpoint, the focus remains on a breakout of the 26047-2736 range for near-term directional guidance.
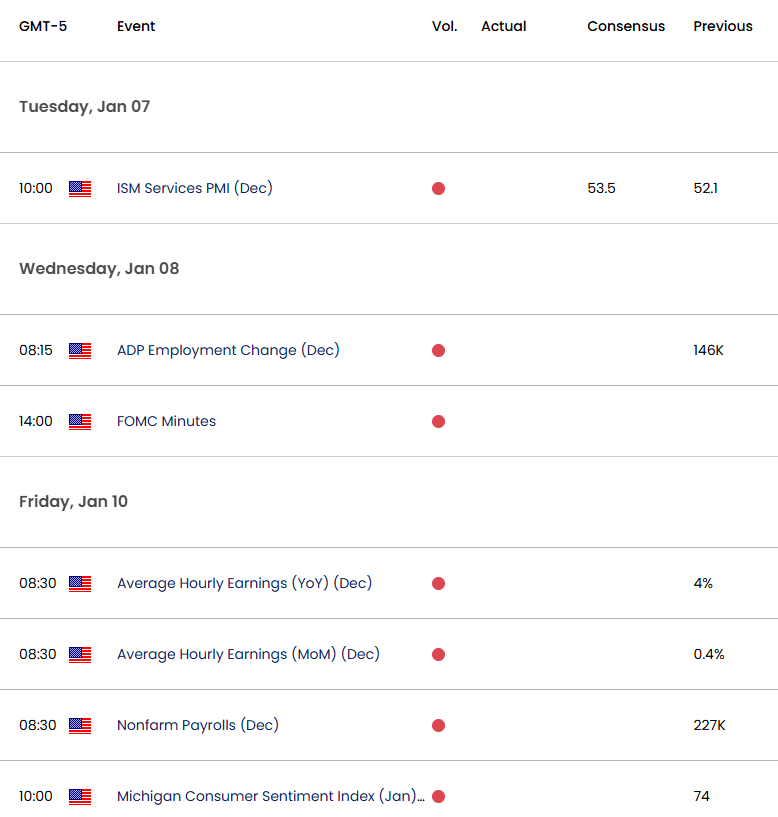
Keep in mind we get the release of key US labor data next week with Non-Farm Payrolls on tap Friday. The January opening-range is taking shape just above long-term slope support- look for the breakout and watch the weekly closes here for guidance. I’ll publish an updated Gold Short-term Outlook once we get further clarity on the near-term XAU/USD technical trade levels.
Key US Economic Data Releases

Economic Calendar - latest economic developments and upcoming event risk.
Active Weekly Technical Charts
- Japanese Yen (USD/JPY)
- Canadian Dollar (USD/CAD)
- British Pound (GBP/USD)
- Australian Dollar (AUD/USD)
- Swiss Franc (USD/CHF)
- US Dollar Index (DXY)
- Euro (EUR/USD)
- Crude Oil (WTI)
--- Written by Michael Boutros, Sr Technical Strategist with FOREX.com
Follow Michael on X @MBForex