Gold Talking Points:
- Last year was a big outing for gold bulls as the metal gained 27.23% in spot, with a maximum gain of 40.61% from the February low to the October high.
- It was the final two months of 2024 that saw gold pullback, and this took place amidst a rising US Dollar and a surge in Bitcoin. The big question now is whether that pullback has more room for price to fall or whether bulls get back on the bid to drive topside continuation scenarios.
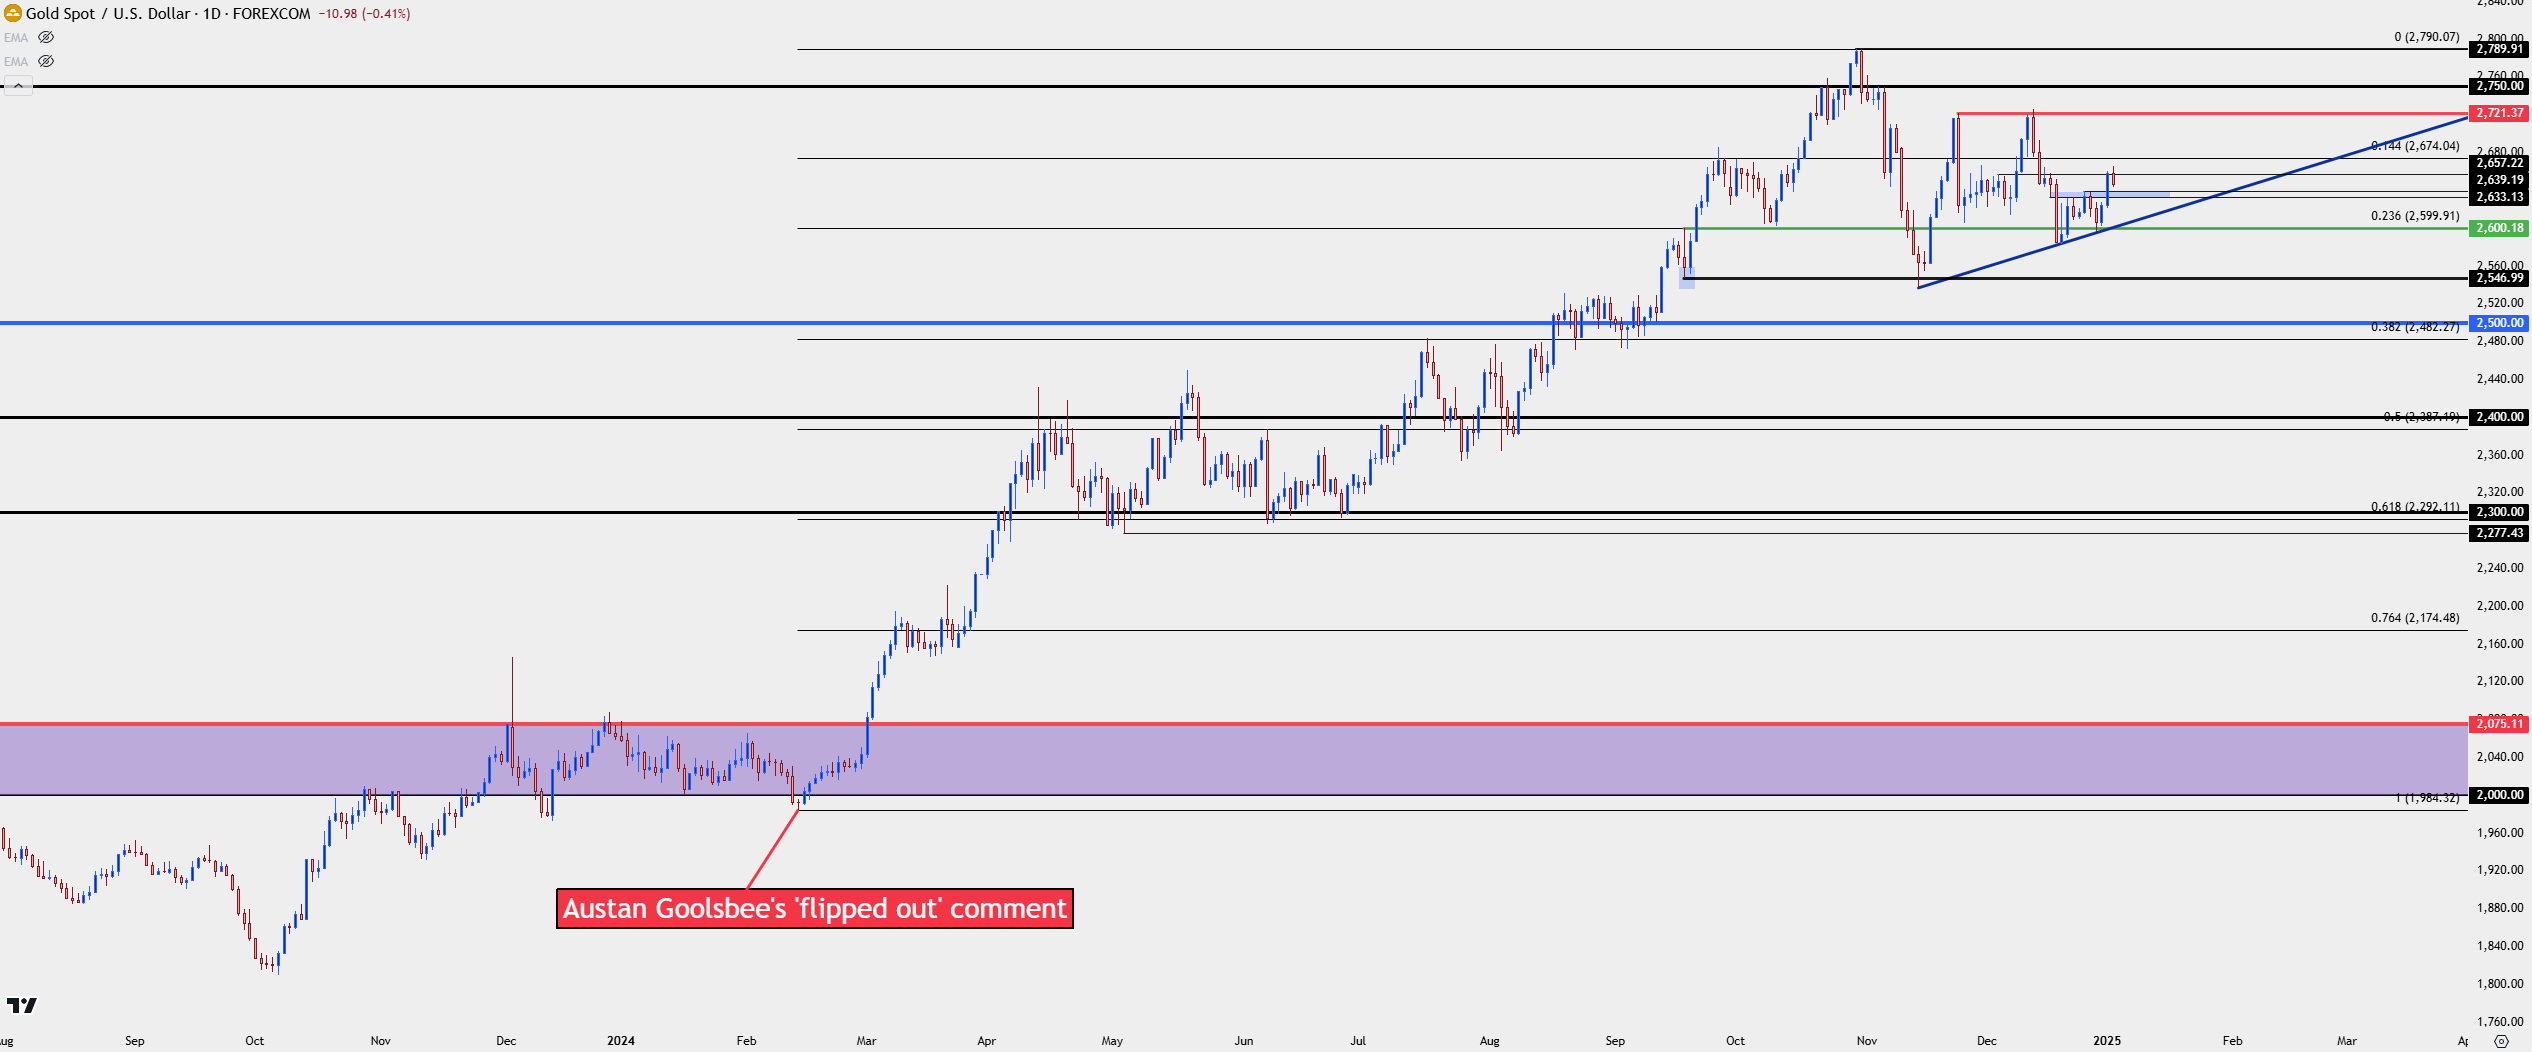
- Coming into last year there remained the question as to whether gold could sustain rallies above the $2,000/oz level. But a comment from Austan Goolsbee in mid-February helped to drive a bullish trend that ran for much of the next eight months and a maximum move of more than 40% in spot XAU/USD.
- I look at gold in-depth during each weekly webinar on Tuesday. You’re welcome to join: Click here for registration information.
Coming into last year there remained the question as to whether gold could sustain any significant rallies above the $2,000/oz psychological level. That price had helped to hold the highs for the prior three-plus years after initially coming into play in the summer of 2020, and multiple attempts from bulls had failed to see continuation upon tests of that price.
But it was in early-2024 trade that $2,000/oz started to show as support, with an inflection on January 17th of last year which saw defense from buyers.
U.S. data remained as somewhat strong with inflation above expectations and there was a very legitimate question as to whether the Fed would be able to start cutting rates in 2024. It was in February, on the back of another above-expected CPI print, that gold finally pushed below the $2,000/oz level. It closed below that price, and it was a day later, in a television interview with Chicago Fed President Austan Goolsbee, when prices began to find support. Goolsbee had noted that market participants should avoid getting ‘flipped out’ about a single inflation print.
That comment helped to prod a bounce in equities and a sell-off in the U.S. Dollar, and for gold, that comment marked the low of last year as gold bulls jumped back on the bid, drove prices above $2,000/oz, and never looked back.
Gold Daily Price Chart
 Chart prepared by James Stanley; data derived from Tradingview
Gold’s Bigger Picture
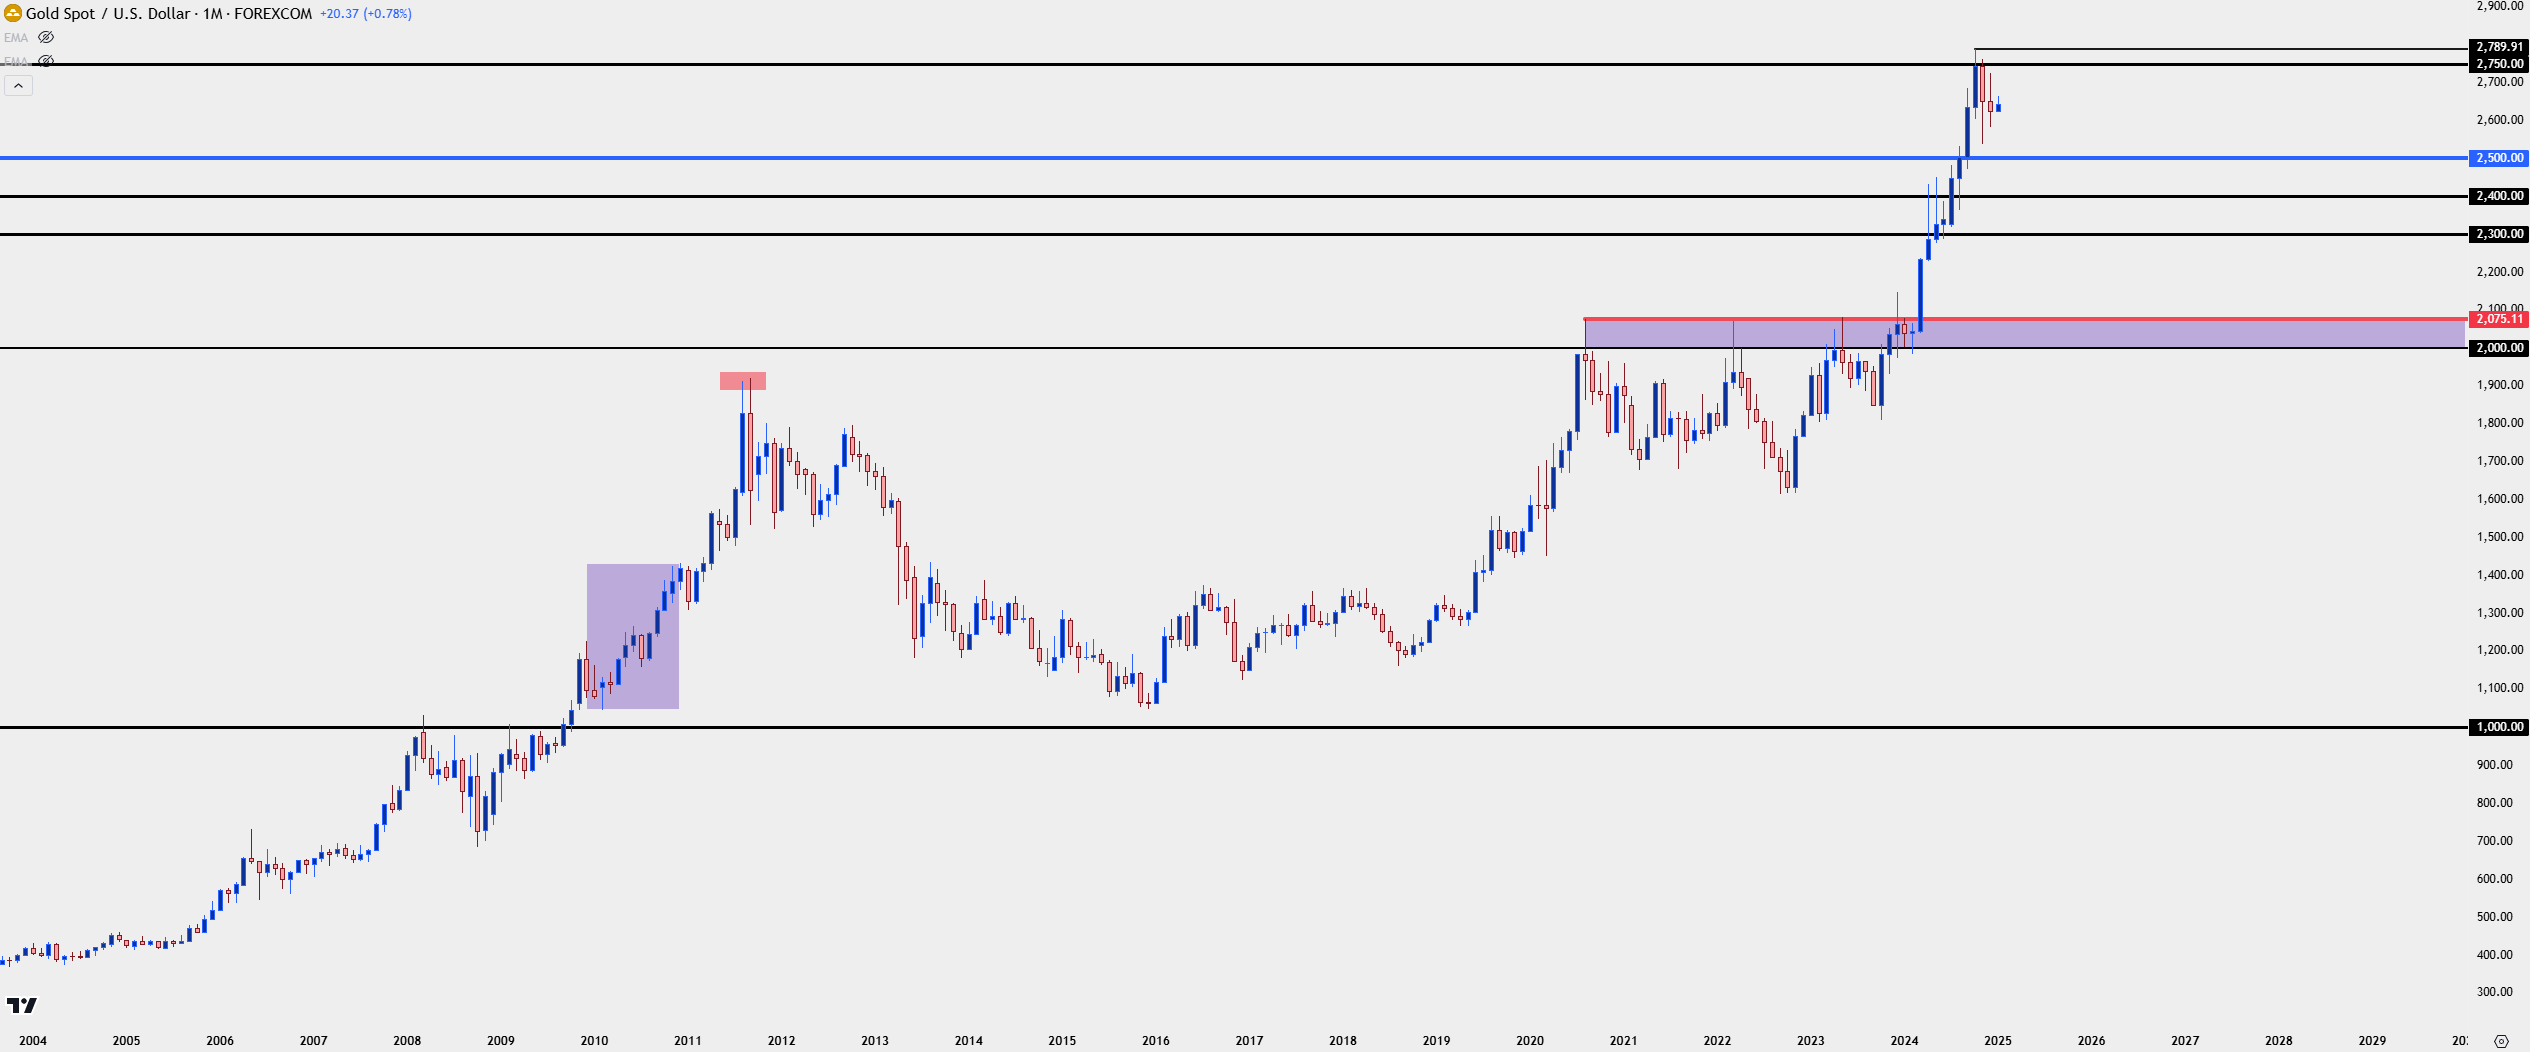
From the weekly chart, last year’s rally doesn’t look too out of place, even if it was gold’s strongest yearly performance since 2010. That prior rally continued through the first half of 2011 until, eventually, resistance showed in August and September. And it was then nine years before gold would be able to set a fresh all-time-high.
This longer-term look also helps to provide some context to the Q4 pullback in gold, which starts to take on the look of profit-taking following a massive rally. The rationale for the rally seems sensible – as the Fed continued to talk up rate cuts despite strong inflation, there was the expectation or a diluted monetary base even though inflation remained strong. And for a non-fiat asset like gold, that can be a bullish factor such as we saw with the reaction to Goolsbee’s dovish comment on February 14th of last year.
Gold Monthly Price Chart
 Chart prepared by James Stanley; data derived from Tradingview
The recent pullback also seems to align with the U.S. Presidential election, and gold prices took a punch on the back of election results. The fact that U.S. Dollar strength has remained since that driver in early-November could further provide some context to the pullback in gold, but there’s perhaps another factor of importance to consider, and that’s also something that may have had some impact back in the summer of 2020 when gold began to show resistance at the $2,000/oz level.
In the summer of 2020 as much of the global economy remained shut down, the Fed responded with bazooka after bazooka of stimulus which helped to drive equity markets to fresh all-time-highs. Initially, gold rallied on the back of this premise; but after $2,000/oz traded in August, suddenly gold bulls seemed disinterested. At the time, Bitcoin was struggling to get back above the $12k level. But in the months that followed, gold prices went range-bound and Bitcoin put in a massive rally that didn’t seem to stop or even stall.
From that episode it appeared as though gold had competition for anti-fiat flows and that could further explain the pullback that showed in the post-election backdrop. As I had written in the aftermath of election results it seemed as though Bitcoin was the big winner. That remained the case into the end of 2024 with BTC/USD mounting above the $100k level to mark a massive 118% move from the August 2024 low to the 2024 high.
But – the sample size here is a mere ‘one’ so that doesn’t mean that we’re due for a repeat of the 2020 episode. And if we look at surrounding context there could even be a more compelling case for a counter-scenario, as Bitcoin was trading near recent support in the prior instance and now, it’s trying to hold a significant psychological level of $100k.
For gold – my point of interest is price action and as noted above, there’s been a show from buyers that they’re responding to pullbacks and support, and that’s something that can keep the door open for topside themes as move into the New Year.
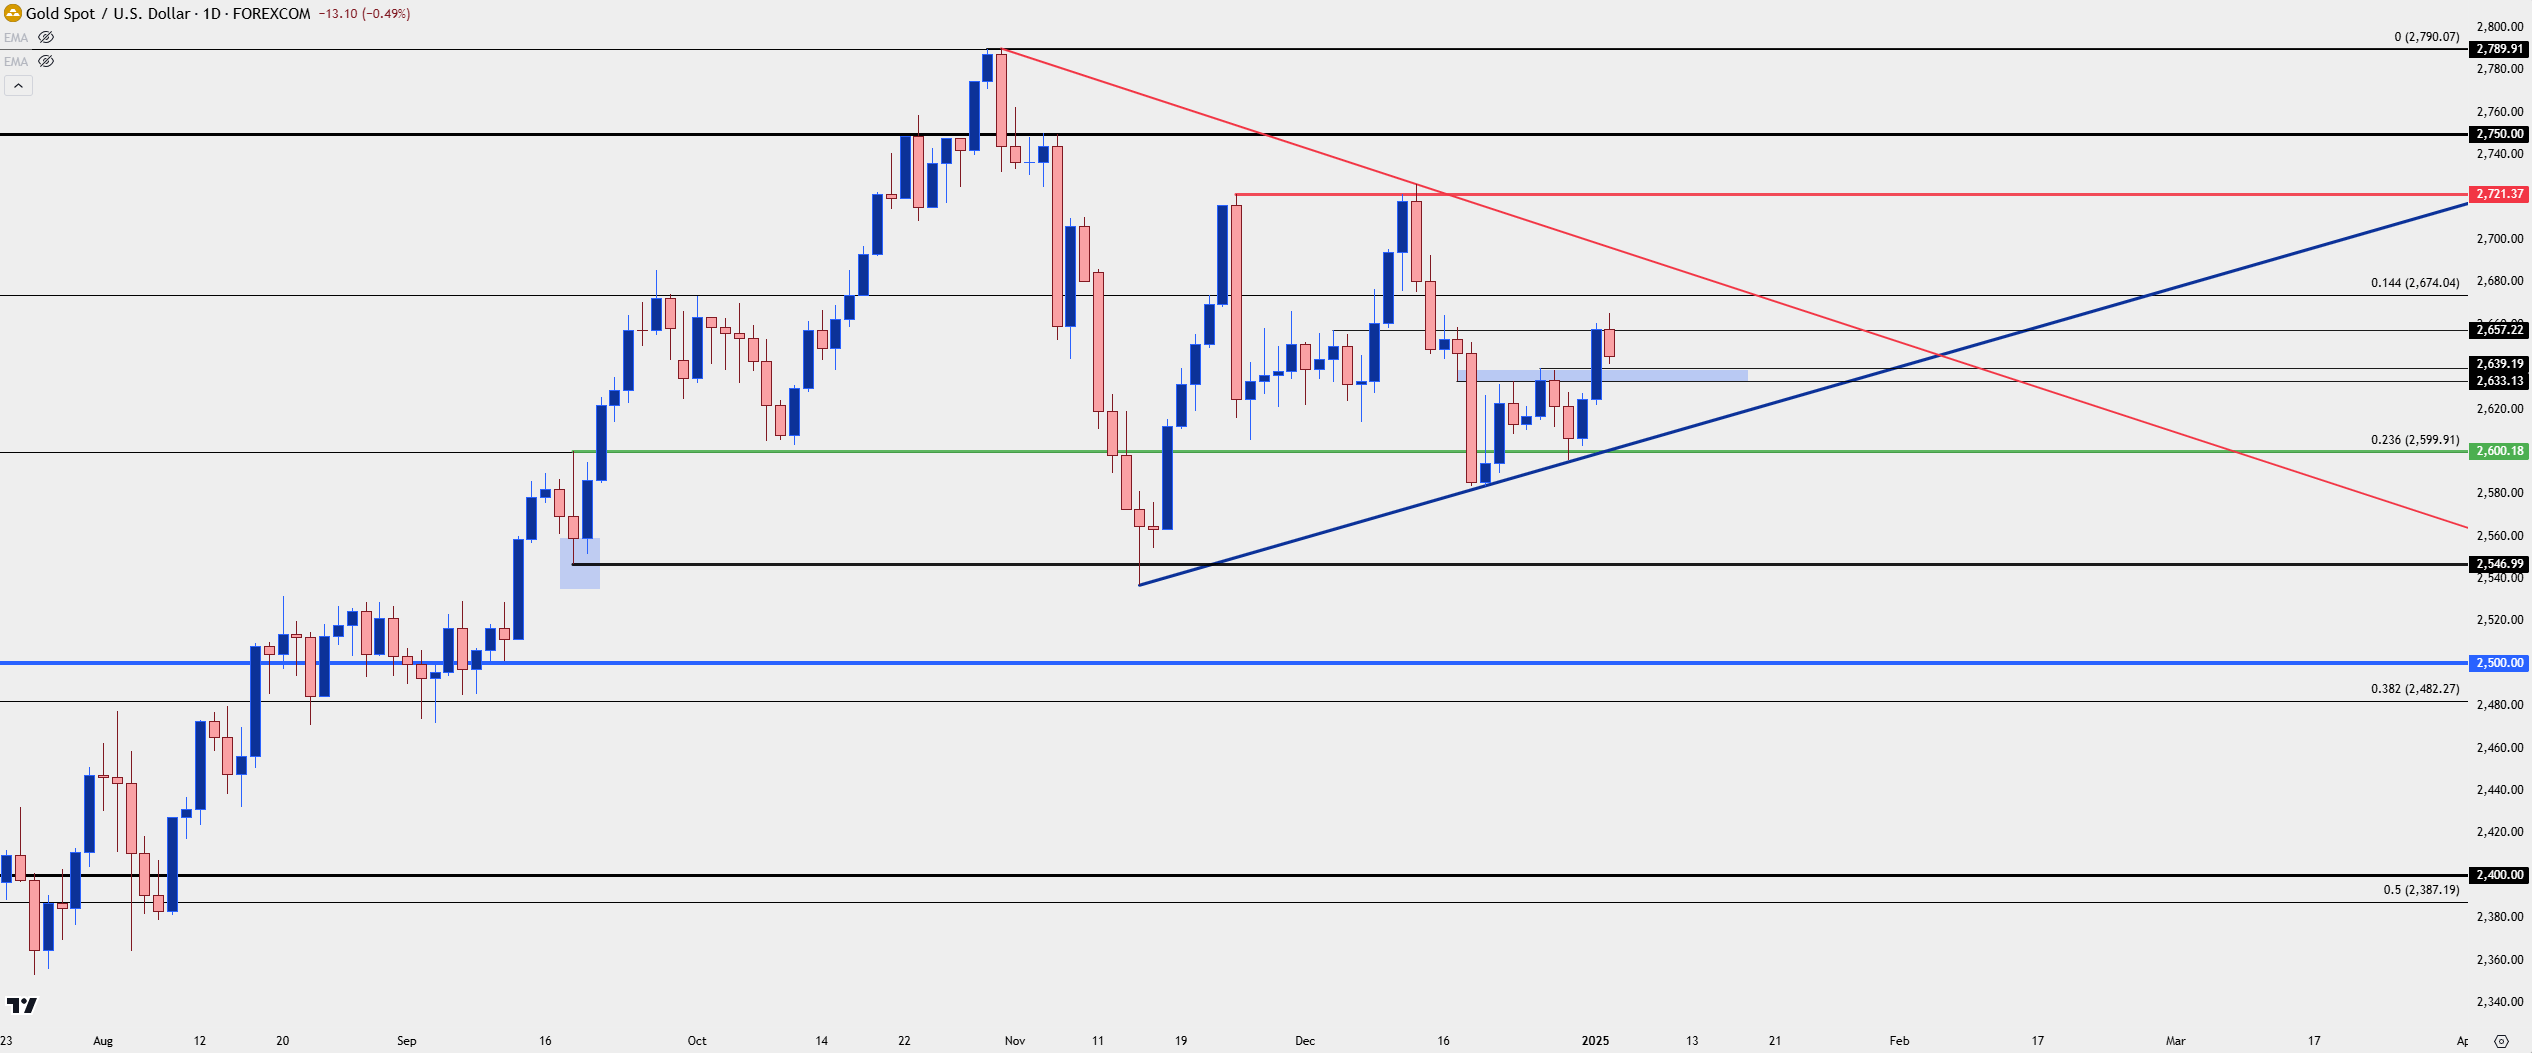
As I had looked at earlier this week, gold prices were testing a big spot of support which also happened to be the resistance that was in-play around the Fed’s first rate cut of this cycle, plotted at the $2,600/oz level.
On the counter-side of the bullish argument, there’s also a series of recent lower-highs to go along with the higher-lows, helping to build a symmetrical triangle formation. Rectification of that would provide additional hope for buyers, and it also highlights a couple of big tests with $2,721 sticking out as important.
Shorter-term there’s support potential t prior resistance, from around $2,633-$2,639. If buyers can hold that support at prior resistance, the door is open for a test of the Fibonacci level at $2,674.
For key support, it’s the $2,600 level that sticks out but, ideally, buyers would hold support above the trendline projection to at least keep the door open for continued digestion within the triangle. Breaches of that bring question to bullish themes in gold.
Gold Daily Price Chart
 Chart prepared by James Stanley; data derived from Tradingview
--- written by James Stanley, Senior Strategist
Gold Talking Points:
- Last year was a big outing for gold bulls as the metal gained 27.23% in spot, with a maximum gain of 40.61% from the February low to the October high.
- It was the final two months of 2024 that saw gold pullback, and this took place amidst a rising US Dollar and a surge in Bitcoin. The big question now is whether that pullback has more room for price to fall or whether bulls get back on the bid to drive topside continuation scenarios.
- Coming into last year there remained the question as to whether gold could sustain rallies above the $2,000/oz level. But a comment from Austan Goolsbee in mid-February helped to drive a bullish trend that ran for much of the next eight months and a maximum move of more than 40% in spot XAU/USD.
- I look at gold in-depth during each weekly webinar on Tuesday. You’re welcome to join: Click here for registration information.
Gold AD
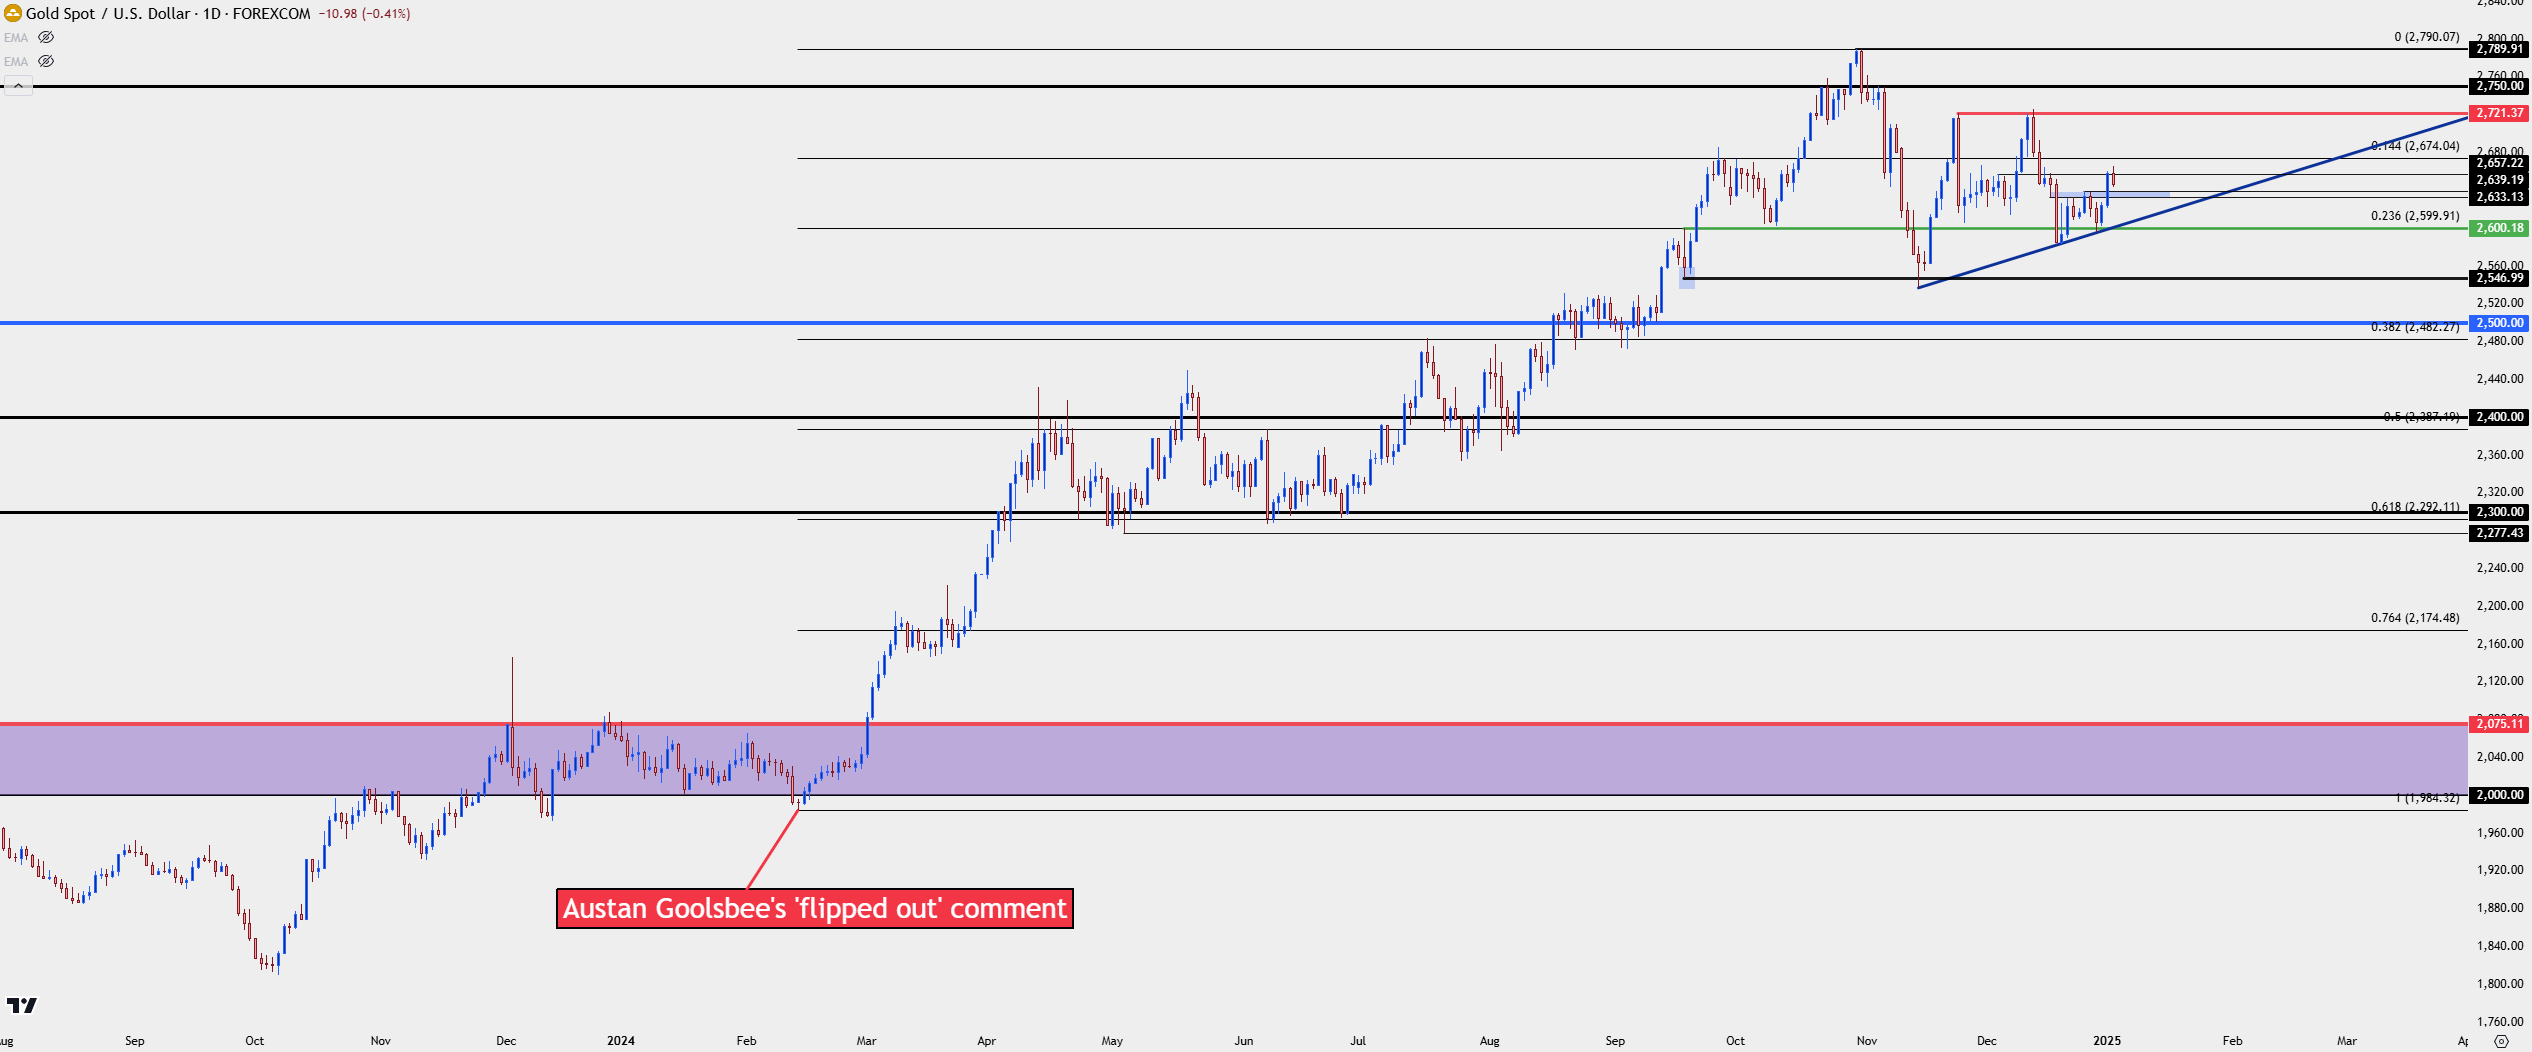
Coming into last year there remained the question as to whether gold could sustain any significant rallies above the $2,000/oz psychological level. That price had helped to hold the highs for the prior three-plus years after initially coming into play in the summer of 2020, and multiple attempts from bulls had failed to see continuation upon tests of that price.
But it was in early-2024 trade that $2,000/oz started to show as support, with an inflection on January 17th of last year which saw defense from buyers.
U.S. data remained as somewhat strong with inflation above expectations and there was a very legitimate question as to whether the Fed would be able to start cutting rates in 2024. It was in February, on the back of another above-expected CPI print, that gold finally pushed below the $2,000/oz level. It closed below that price, and it was a day later, in a television interview with Chicago Fed President Austan Goolsbee, when prices began to find support. Goolsbee had noted that market participants should avoid getting ‘flipped out’ about a single inflation print.
That comment helped to prod a bounce in equities and a sell-off in the U.S. Dollar, and for gold, that comment marked the low of last year as gold bulls jumped back on the bid, drove prices above $2,000/oz, and never looked back.
Gold Daily Price Chart
 Chart prepared by James Stanley; data derived from Tradingview
Gold’s Bigger Picture
From the weekly chart, last year’s rally doesn’t look too out of place, even if it was gold’s strongest yearly performance since 2010. That prior rally continued through the first half of 2011 until, eventually, resistance showed in August and September. And it was then nine years before gold would be able to set a fresh all-time-high.
This longer-term look also helps to provide some context to the Q4 pullback in gold, which starts to take on the look of profit-taking following a massive rally. The rationale for the rally seems sensible – as the Fed continued to talk up rate cuts despite strong inflation, there was the expectation or a diluted monetary base even though inflation remained strong. And for a non-fiat asset like gold, that can be a bullish factor such as we saw with the reaction to Goolsbee’s dovish comment on February 14th of last year.
Gold Monthly Price Chart
 Chart prepared by James Stanley; data derived from Tradingview
The recent pullback also seems to align with the U.S. Presidential election, and gold prices took a punch on the back of election results. The fact that U.S. Dollar strength has remained since that driver in early-November could further provide some context to the pullback in gold, but there’s perhaps another factor of importance to consider, and that’s also something that may have had some impact back in the summer of 2020 when gold began to show resistance at the $2,000/oz level.
In the summer of 2020 as much of the global economy remained shut down, the Fed responded with bazooka after bazooka of stimulus which helped to drive equity markets to fresh all-time-highs. Initially, gold rallied on the back of this premise; but after $2,000/oz traded in August, suddenly gold bulls seemed disinterested. At the time, Bitcoin was struggling to get back above the $12k level. But in the months that followed, gold prices went range-bound and Bitcoin put in a massive rally that didn’t seem to stop or even stall.
From that episode it appeared as though gold had competition for anti-fiat flows and that could further explain the pullback that showed in the post-election backdrop. As I had written in the aftermath of election results it seemed as though Bitcoin was the big winner. That remained the case into the end of 2024 with BTC/USD mounting above the $100k level to mark a massive 118% move from the August 2024 low to the 2024 high.
But – the sample size here is a mere ‘one’ so that doesn’t mean that we’re due for a repeat of the 2020 episode. And if we look at surrounding context there could even be a more compelling case for a counter-scenario, as Bitcoin was trading near recent support in the prior instance and now, it’s trying to hold a significant psychological level of $100k.
For gold – my point of interest is price action and as noted above, there’s been a show from buyers that they’re responding to pullbacks and support, and that’s something that can keep the door open for topside themes as move into the New Year.
As I had looked at earlier this week, gold prices were testing a big spot of support which also happened to be the resistance that was in-play around the Fed’s first rate cut of this cycle, plotted at the $2,600/oz level.
On the counter-side of the bullish argument, there’s also a series of recent lower-highs to go along with the higher-lows, helping to build a symmetrical triangle formation. Rectification of that would provide additional hope for buyers, and it also highlights a couple of big tests with $2,721 sticking out as important.
Shorter-term there’s support potential t prior resistance, from around $2,633-$2,639. If buyers can hold that support at prior resistance, the door is open for a test of the Fibonacci level at $2,674.
For key support, it’s the $2,600 level that sticks out but, ideally, buyers would hold support above the trendline projection to at least keep the door open for continued digestion within the triangle. Breaches of that bring question to bullish themes in gold.
Gold Daily Price Chart
 Chart prepared by James Stanley; data derived from Tradingview
--- written by James Stanley, Senior Strategist
