Canadian Dollar Talking Points:
- USD/CAD just closed above 1.4000 to finish the year for the first time since 2002.
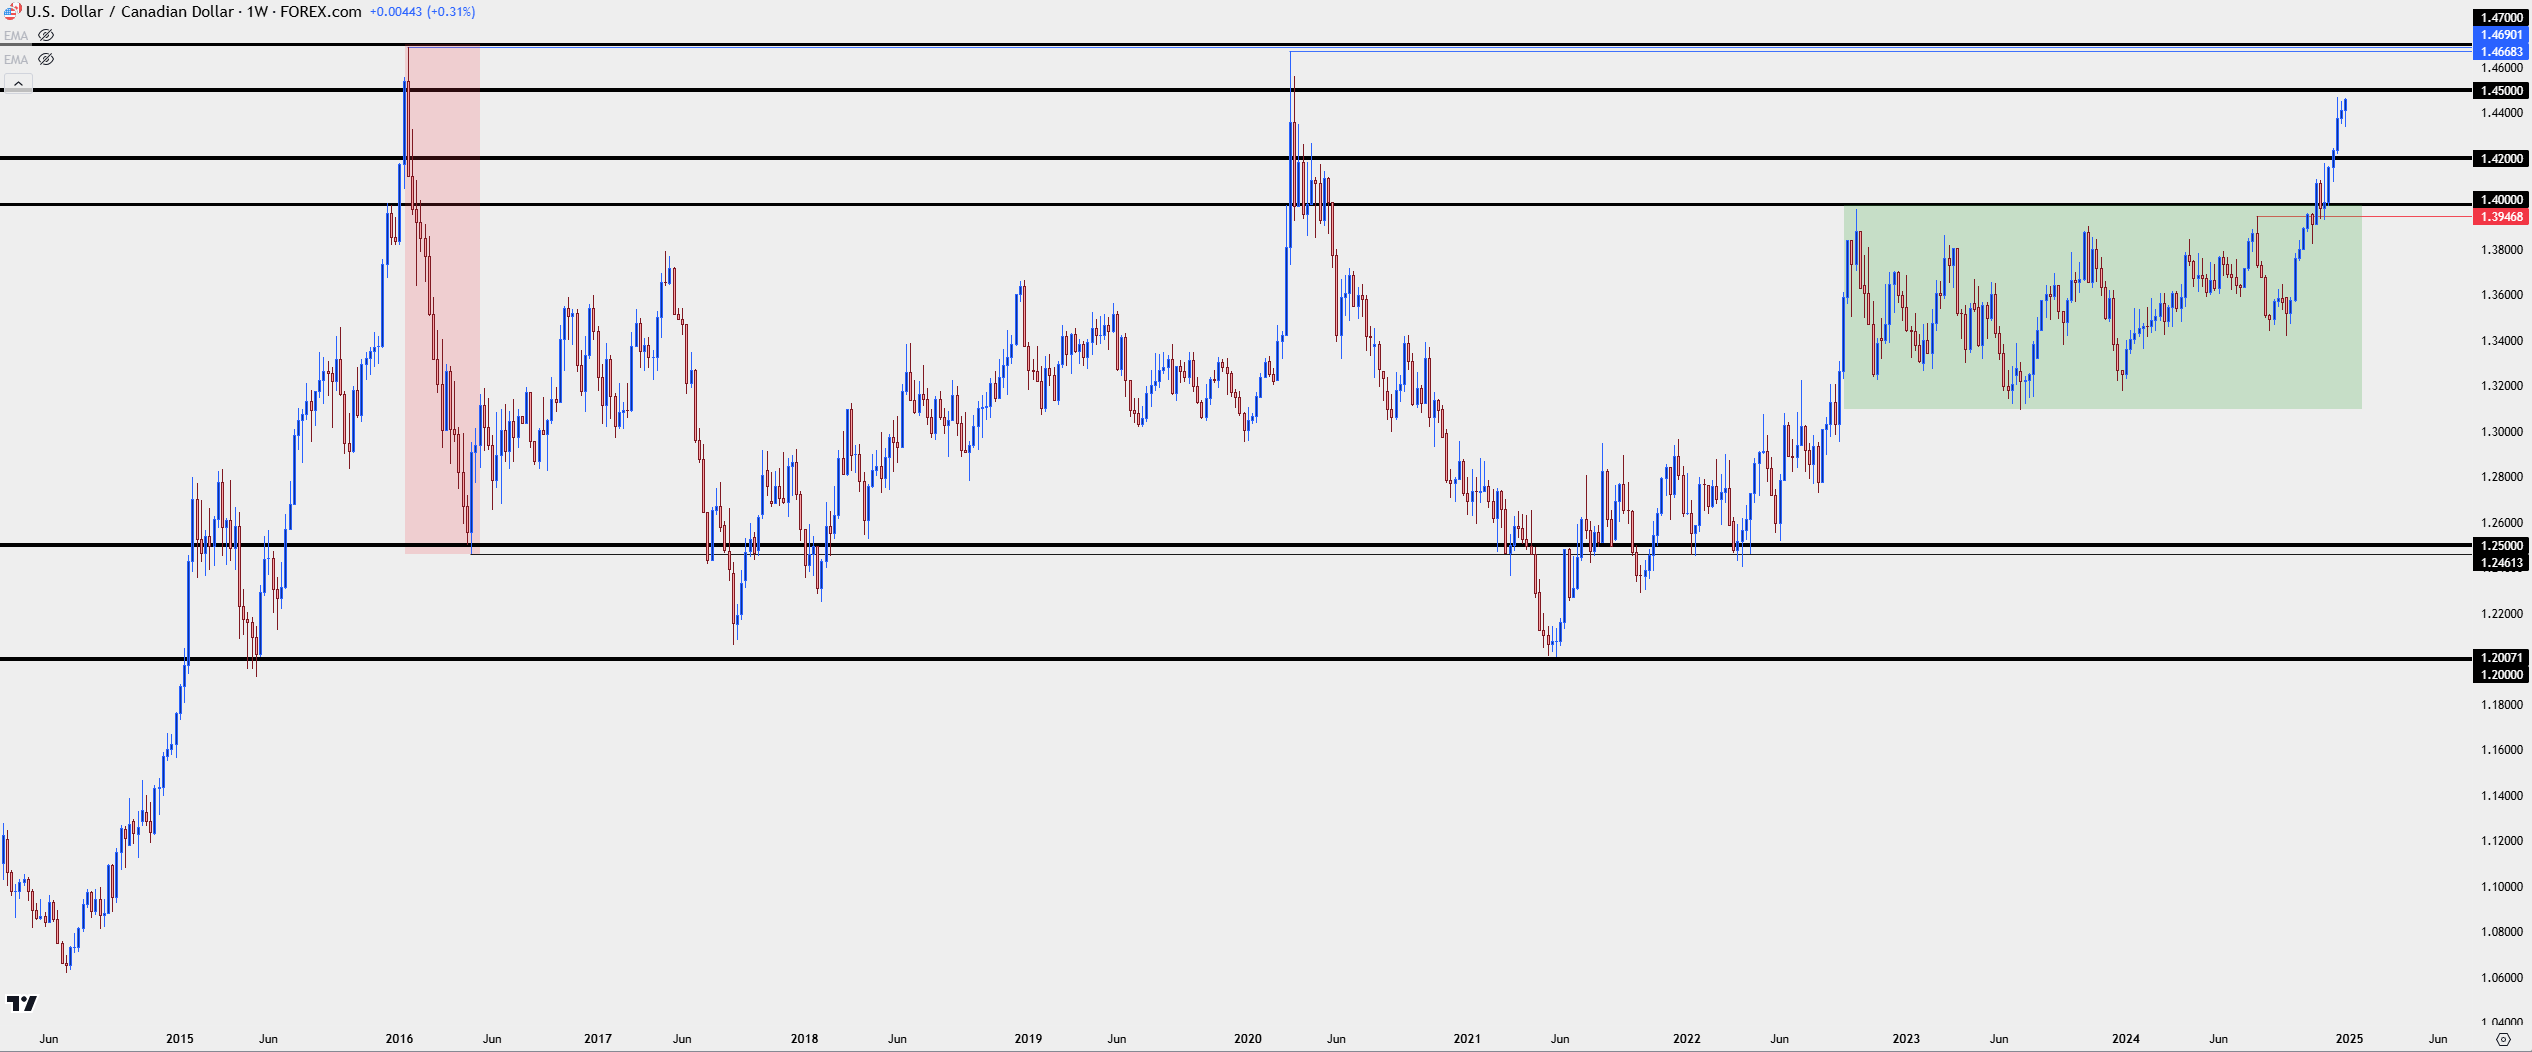
- Over the past decade there have been two separate instances of USD/CAD testing above the 1.4000 handle, and in both cases, price topped within 32 pips of the 1.4700 level.
- A key fundamental driver behind the recent breakout has been the prospect of tariffs, which has been spoken to multiple times by President-elect Trump. At the BoC’s rate cut in December, Governor Tiff Macklem noted that it introduces uncertainty and that’s something that investors generally abhor. But the larger question now is execution and whether the President-elect would want to risk a stronger U.S. Dollar and possibly greater inflation by adding tariffs on Canadian energy. If he does back away from the tariff threat, mean reversion scenarios can become attractive in USD/CAD.
Indices AD
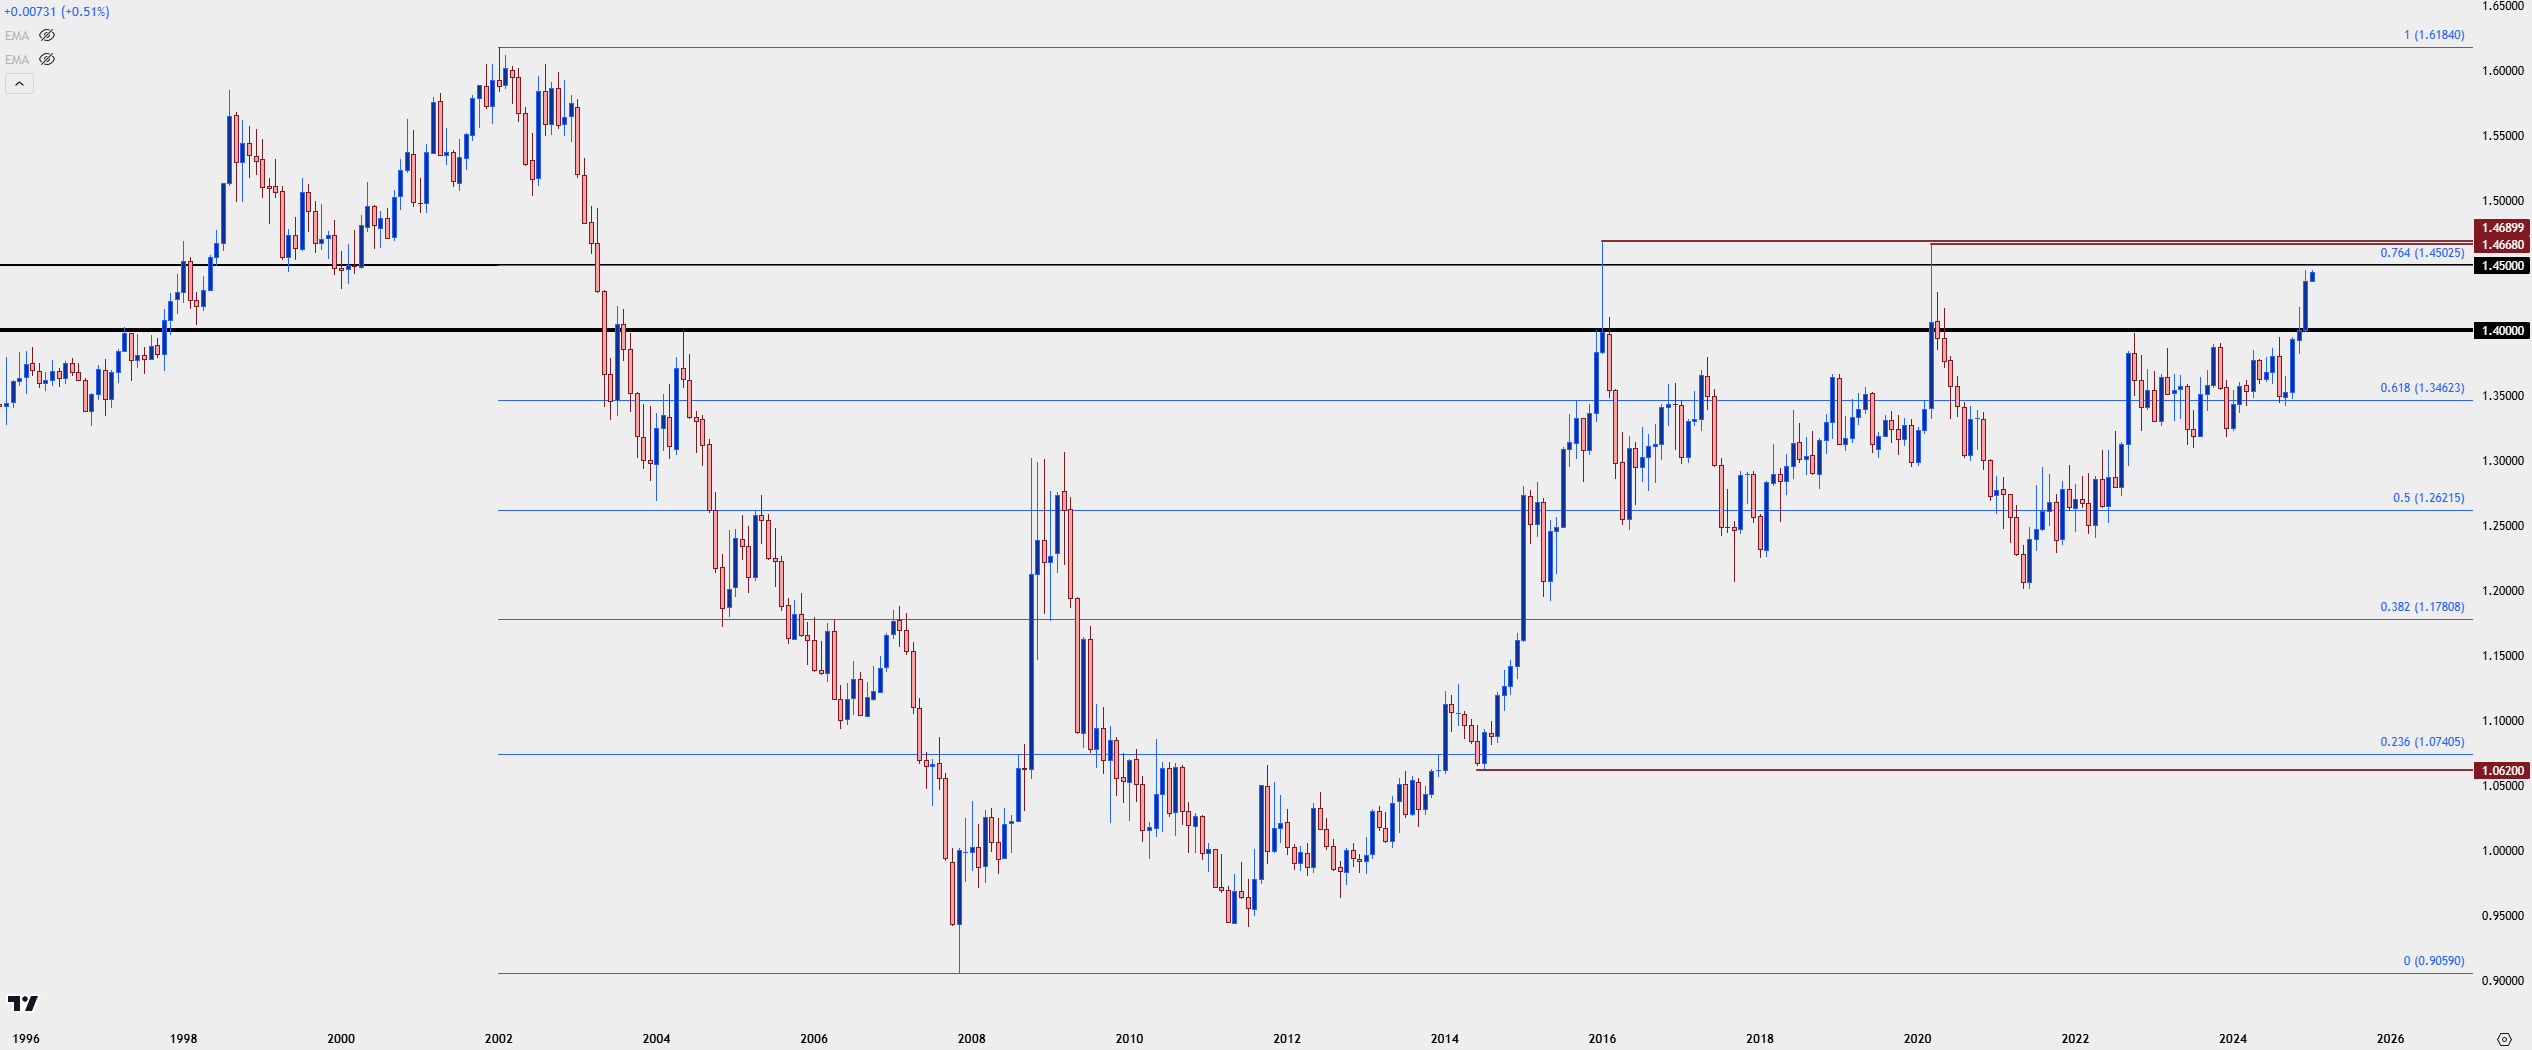
USD/CAD just finished the year above the 1.4000 level for the first time since 2002. This isn’t to say that there weren’t tests above that price since then and there’s been two separate episodes over the past decade of such. But the 1.4000 level remains a major spot on the chart and the recent bullish trend has shown a degree of consistency that must be respected as we’ve opened the year above that price for the first time in two decades for USD/CAD.
USD/CAD Monthly Chart
 Chart prepared by James Stanley, USD/CAD on Tradingview
USD/CAD 1.4000
In 2015, the 1.4000 level showed as resistance into the end of that year. But in January of 2016 price jumped above and continued to rally until ultimately topping on January 20th, setting a high of 1.4690. By the end of that month the pair had already fallen back-below the 1.4000 handle, exposing a wide upper wick on that candle that led into a strong reversal for the next three months with price ultimately finding support around the 1.2500 level in early-May.
The next 1.4000 test appeared amidst the backdrop of Covid, as the U.S. Dollar was gaining, driven by safe-haven flows. Similar to the prior episode, 1.4000 showed as short-term resistance before bulls were ultimately able to take-over the level. That breakout ran until a high showed at 1.4668.
That episode similarly showed an aggressive reversal but, this time, it took a couple months for bears to ultimately leave the 1.4000 level in the rear view, and once they had control they were able to make a run down towards the 1.2000 handle (with the 2021 low printing at 1.2007).
This helps to highlight the mean-reverting, range-bound backdrop of the pair over the past decade, as it was January of 2015 when USD/CAD began its climb above the 1.2000 level. This, of course, does not assure that the range will hold – but it does provide important context as we move into a fresh year which I’ll extrapolate on below.
USD/CAD Weekly Chart
 Chart prepared by James Stanley, USD/CAD on Tradingview
USD/CAD: The Breakout
I had followed this theme rather closely in Q4 as it was the initial threat of tariffs from President-elect Trump that seemed to really excite USD/CAD bulls. By mid-December it seemed as though there was even somewhat of a jovial manner around the issue, with Trump calling Canada the 51st U.S. state, and calling Canadian Prime Minister Justin Trudeau a ‘governor.’ But regardless of whether it was sarcasm or not, markets abhor uncertainty, and as noted by Tiff Macklem at the Bank of Canada’s 50 bp rate cut in December, this introduced brutal uncertainty. Investors and markets generally abhor uncertainty and given the vulnerability of the Canadian economy to such a threat, it’s reasonable to image much of the recent breakout has been driven by that prospect.
But perhaps the bigger question as we move closer towards inauguration is whether Trump would want to take on the risk of ramifications from tariffs on Canada. As we saw in the prior administration there’s a strong inflationary component from energy as the United States is forced to use trucking to deliver many goods throughout the country; and higher energy costs can increase the cost of most of those products as it’s now more expensive to deliver. Higher inflation puts more pressure on the Fed for higher rates, which can act as a hindrance for corporates ability to grow. So if it comes down to higher stock prices or tariffs on Canada, I believe the President-elect would bias towards stronger stock prices and away from punitive measures on the northern neighbor.
After all, there’s a reason that USD/CAD has a proclivity to range and that’s the important cross-border trade relationship that often shares both benefit and cost: If something is good for the United States it often has some shared potential with Canada and vice versa. And as the U.S. has become increasingly globalized that effect has only been more and more profound, as witnessed by the past decade of range-bound behavior in USD/CAD.
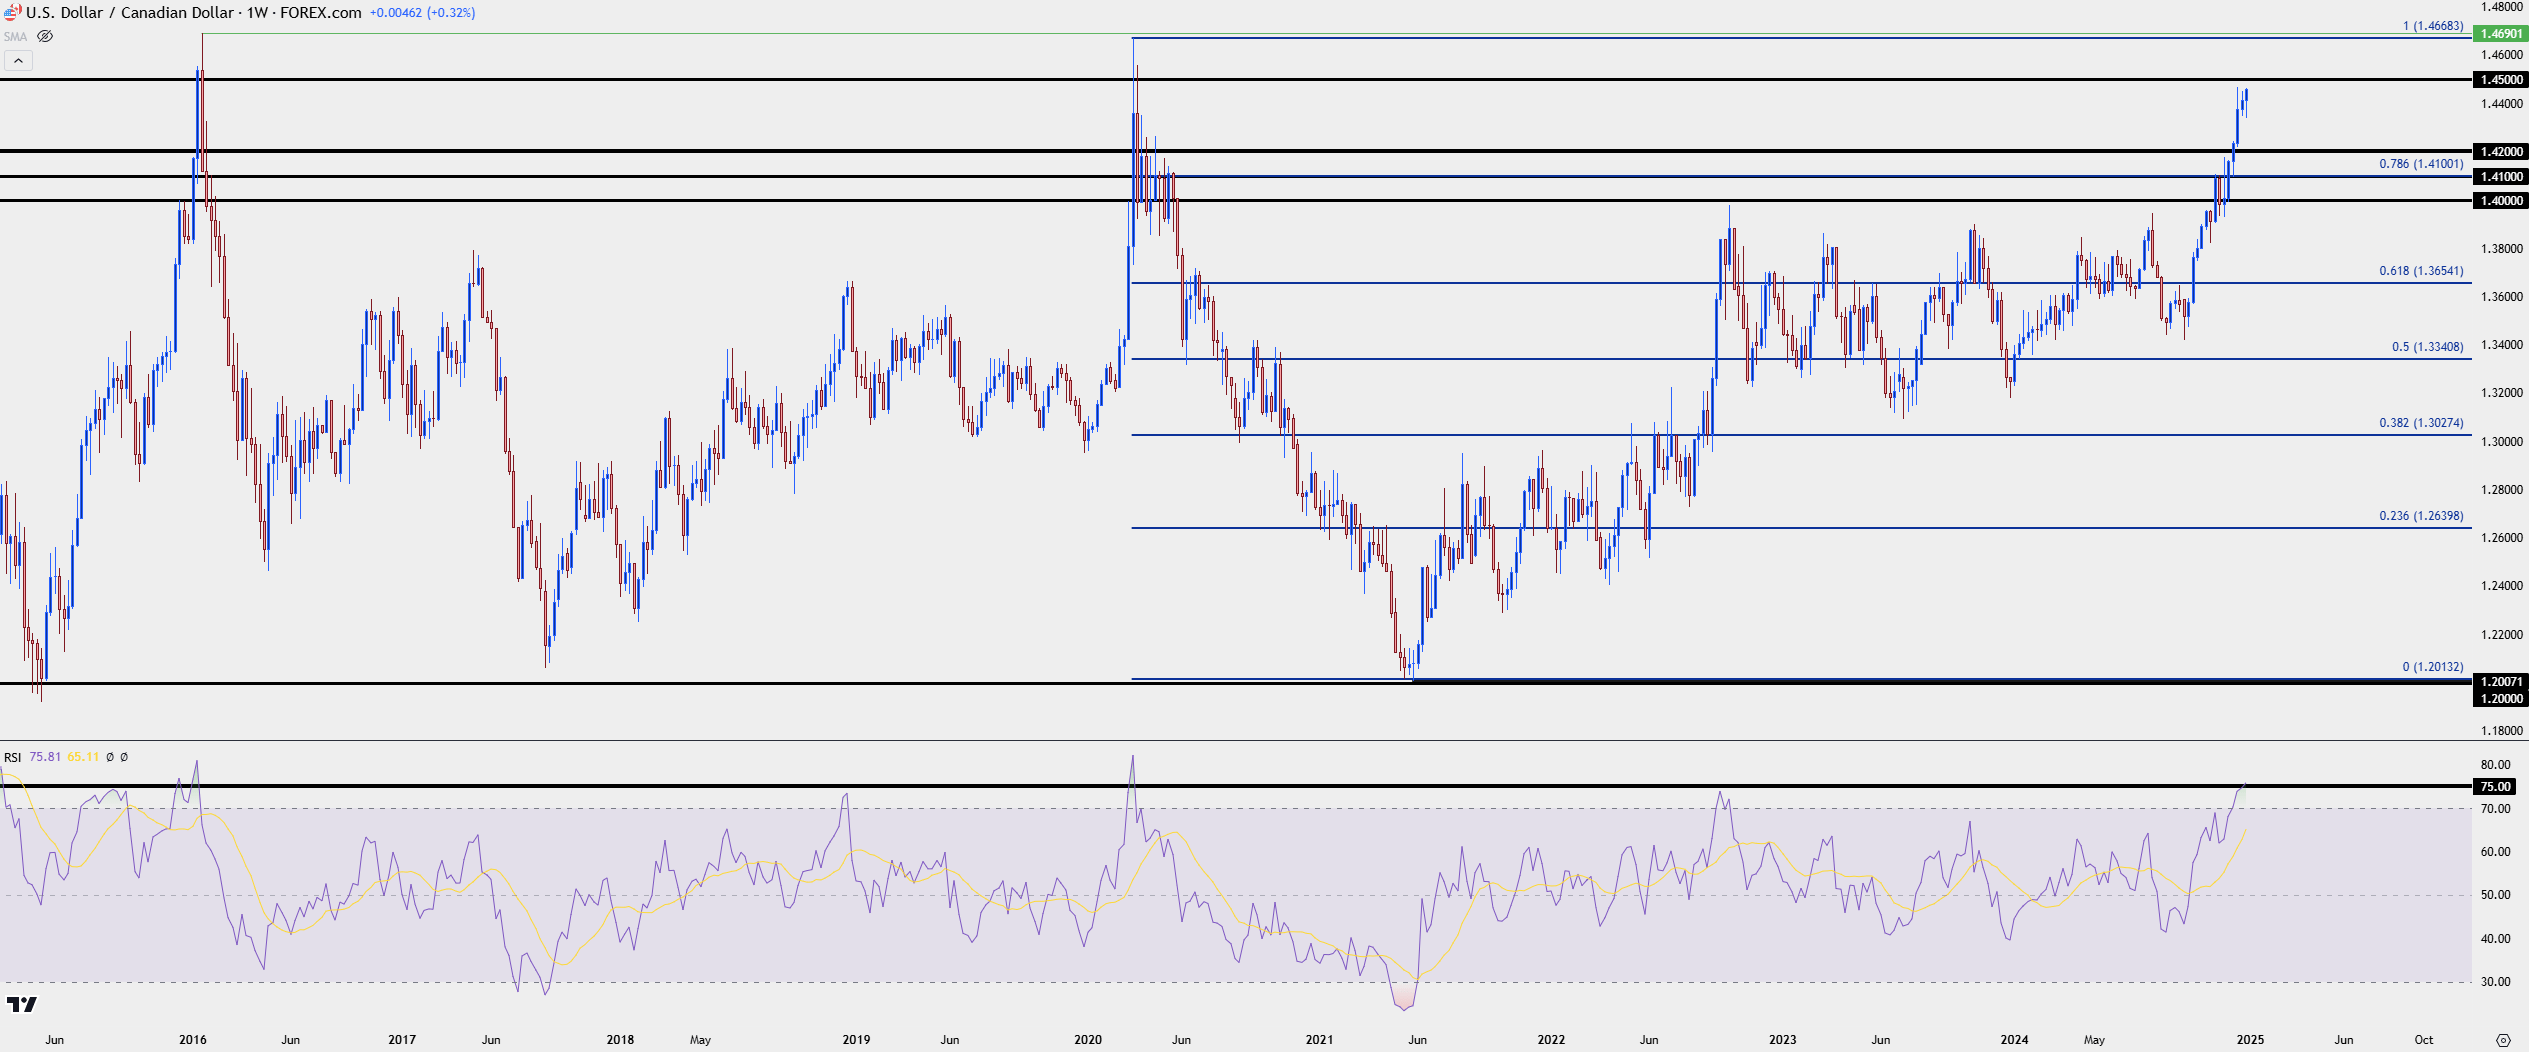
With all that said, I think it’s always important to draw such scenarios back to the most important market measure for traders, and that’s price. And as of right now the bullish trend remains strong and aggressive and there’s not yet scope for reversal into the longer-term, mean-reverting backdrop of USD/CAD.
As seen from the prior two episodes investigated above, a breach back-below 1.4000 is what would make the prospect of longer-term mean-reversion remaining a more attractive variable. Until then, there’s a couple of key spots of resistance potential sitting overhead. The 1.4500 psychological level is confluent with the 76.4% retracement of the 2002-2007 major move looked at earlier in this article. And then above that we have the 2016 and 2020 highs, both just inside of the 1.4700 level.
Notably RSI on the weekly chart is showing overbought, above 75.00 as of this writing, and the last time the indicator was that elevated was the episode in March of 2020.
USD/CAD Weekly Chart
 Chart prepared by James Stanley, USD/CAD on Tradingview
--- written by James Stanley, Senior Strategist