The past few days have been rough for the S&P 500.
It has weakened roughly 1.3% since the start of the week thanks to renewed expectations around the Federal Reserve keeping interest rates higher for longer. The main culprit behind this development was none other than Federal Reserve Chair Jerome Powell who struck a hawkish tone in congressional testimony on Tuesday. According to Powell, interest rates will likely peak at a higher level than previously expected thanks to stronger-than-expected economic data. His aggressive message rate hikes boosted the dollar and rattled equity markets as a 50-bp hike in March was back on the table.
According to Bloomberg, traders are currently pricing in a 68% probability of a 50-basis point rate hike this month.
As the week slowly comes to an end, the S&P 500 is still struggling to nurse the deep wounds inflicted from Tuesday’s selloff with prices trading below the 4000 level. The index is likely to remain shaky as investors remain on the sidelines ahead of the US jobs report on Friday.
In the meantime, bears seem to be gaining momentum on the daily charts with prices trading below the 50-day Simple Moving Average.
However, some support can be found around 3950 – a level entangled between the 100 and 200-day SMA.
On the data front, it may be wise to keep an eye on the US weekly jobless claims published later today. If the official results exceed the forecasted 195,000 figure, that could provide some breathing room for the S&P 500 to fight back ahead of the NFP main course tomorrow. On the political front, US President Biden’s budget request to Congress could trigger some volatility depending on how events play out.
The main risk event and market shaker will be the NFP report on Friday which could determine whether S&P 500 bears continue their reign.
After the blockbuster 517,000 figures back in January, around 225, 000 is projected in February. A number below market expectations could excite equity bulls and cool expectations around the Federal Reserve hiking interest rates by 50-bp this month. Alternatively, a strong report is likely to reinforce rate hike bets - ultimately weighing on the equity space.
Shifting the fundamentals aside, the technicals remain in favour of bears as prices remain in a descending channel.
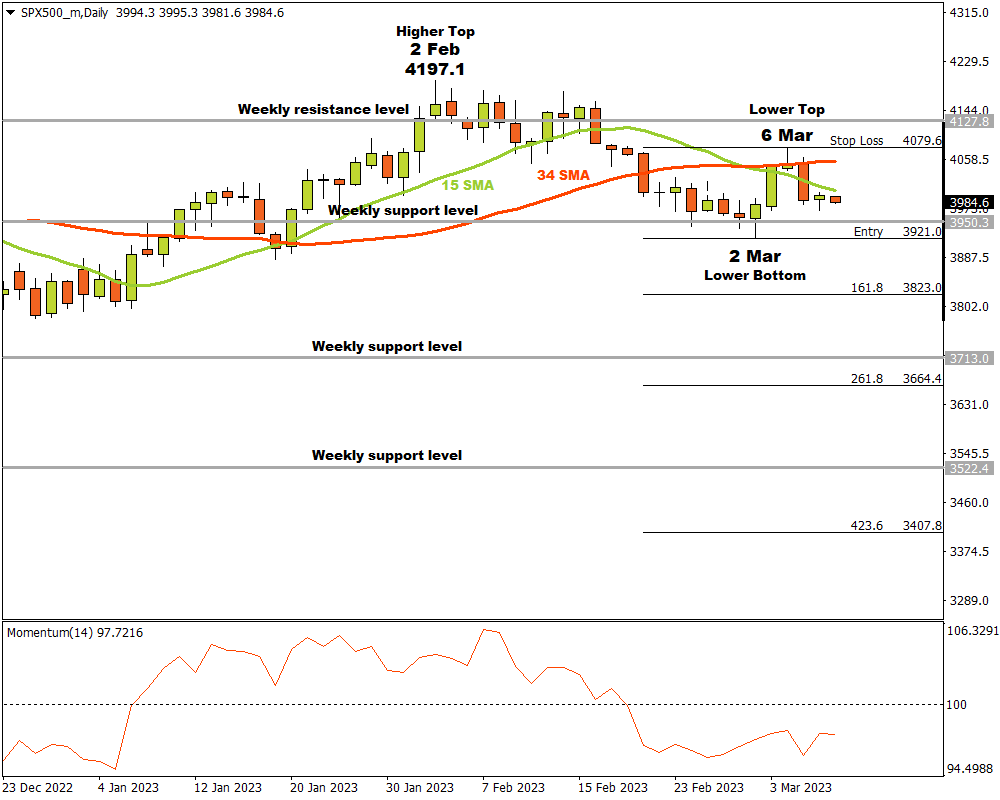
The SPX500m on the D1 time frame was in an uptrend until a last higher top formed at 4197.1 on 2 February. The bears saw an opportunity and started gathering in numbers.
After the higher top at 4197.1, the price broke through a weekly support then turned resistance level. The momentum change was confirmed by a break of the 15 & 34 Simple Moving Averages as well as the Momentum Oscillator that crashed through the 100 baselines into bearish territory.
A possible critical support level formed when the price reached a weekly support level and a lower bottom was recorded on 2 March at 3921.0. The bulls drove the price higher but their momentum waivered and a lower top formed on 6 March at 4079.6.
If the SPX500 breaks through the critical support level at 3921.0, then three possible price targets can be reached from there. Attaching the Fibonacci tool to the lower bottom near the weekly support level at 3921.0 and dragging it to the resistance level at 4079.6, the following targets can be calculated. The first target may be estimated at 3823.0 (161.8%). The second price target might be expected at 3664.4 (261.8%) if the bears manage to break through another weekly support level. The third and final target might be estimated at 3407.8 (423.6%), which is beyond yet another weekly support level.
If the resistance level at 4079.6 is broken, the current situation must be re-examined.
As long as the bears maintain their overall momentum, the outlook for the SP 500 should remain bearish.
